GOVERNOR CHRISTIE’S UNFAIR SCHOOL FUNDING PLAN: PART I
THE GOVERNOR IS WRONG ON HOW MUCH DISTRICTS SPEND
Governor Christie attempts to justify his plan to take massive amounts of school aid away from districts with the most disadvantaged students by making claims about New Jersey school funding that just aren’t true.
One example: To bolster his contention that poor urban districts – the former “Abbott” districts – spend extravagantly and waste money, the Governor uses flawed and misleading data to compare per pupil spending among districts. The Governor wildly and deliberately overstates the amount of money actually available to districts to educate their students. Here are the real facts on per-pupil spending by New Jersey’s districts.
The Governor’s Made-Up Number: “Total Spending Per Pupil”
In pitching his plan to dramatically reduce aid to NJ’s poorest districts, Governor Christie trots out a number he calls “total spending per pupil.” This measure was first concocted when he took office in 2010, but had never before been used by educators, legislators, school finance experts or anyone else to calculate spending on currently enrolled students. To support his fabricated narrative of high spending, the Governor includes in his numbers significant fixed and legacy costs that do not pay for the teachers, support staff, curricular materials, building maintenance or operation of the educational program for students enrolled in districts during the school year.
For example, the Governor lumps into his calculation of school spending the cost of pensions and social security payments made by the State to retirees, debt service on capital borrowing, and state payments for districts’ share of debt service for school construction bonds issued by the NJ Schools Development Authority. The Governor also throws in other fixed costs that vary significantly among districts, such as transportation, food service, and capital outlay. By adding in these items, the Governor is able to “pump up” his claims of high spending even though these costs are not – and have never been – recognized as part of the actual amounts districts spend per pupil to educate current students.
On top of that, the Governor simply ignores the fact that the highest spending districts, even by his own inflated numbers, are not all former Abbott districts, as he often says. Of the 100 highest “total spending per pupil” districts, 25 are in low wealth communities, 38 are in middle wealth communities, and 23 are in the highest wealth communities. The remaining 14 are either unclassified by wealth (4), charters (2), or county vocational districts (8).
Actual District Spending: Budgetary Per Pupil Cost
Governor Christie uses his misleading “total spending per pupil” numbers to try to sell his plan to cut aid to needy students. But he ignores the NJ Department of Education’s (NJDOE) more appropriate “budgetary per pupil cost,” formerly called the “comparative cost per pupil.” This measure has been used by NJDOE for years to make fair comparisons among districts by not including fixed debt service and pension legacy costs, and by excluding spending that varies significantly among districts. By leaving out spending categories such as transportation and capital expenses, this measure provides a more accurate calculation of the money spent by districts on educating currently enrolled students in any given school year. The NJDOE also groups districts by grade configuration and enrollment to create more “apples-to-apples” comparisons among like districts.
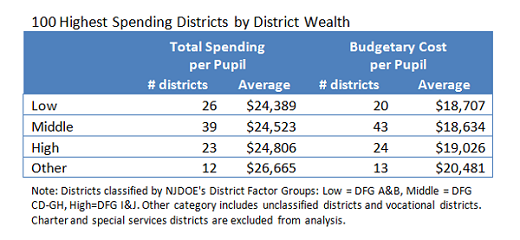
As reported by NJDOE, the 100 districts with the highest “budgetary per pupil cost” include fewer low wealth districts and more middle wealth districts, but with representation from all district types. This calculation, unlike the Governor’s exaggerated numbers, gives a more precise picture of the amount districts actually spend to educate students. But one thing this calculation does not account for is the vast differences in student need in districts across the state, including poverty level (at-risk students), English language proficiency, and disability, all of which significantly impact the cost of providing a thorough and efficient education for all students. Part II of this series illustrates a better, and fairer, way to compare the resources available in school districts across the state.
Press Contact:
Sharon Krengel
Policy and Outreach Director
skrengel@edlawcenter.org
973-624-1815, x 24
Press Contact:
Sharon Krengel
Director of Policy, Strategic Partnerships and Communications
skrengel@edlawcenter.org
973-624-1815, x240