This report was updated on January 3, 2022 to correct a computing error on the funding level measure.
Introduction
Making the Grade 2021 paints a bleak picture of the condition of public education finance systems across the nation. There are vast gaps in overall levels of school funding among states. Far too many states, primarily across the South and West, have funding levels that are thousands of dollars per pupil below the national average. And most states do not provide higher levels of funding to deliver the extra resources necessary to educate students from low-income families and students in high-poverty schools and districts. Importantly, many states simply refuse to make the fiscal effort required to adequately fund PK-12 education relative to their economic capacity. A handful of states – Florida, Louisiana, Nevada, and Tennessee – perform poorly across the board.
Millions of the nation’s students are consigned to schools lacking in the resources essential to afford them a meaningful opportunity for success in school. The need for school finance reform remains urgent and long overdue. The obligation to undertake these reforms rests squarely on state governors and legislators. By law, they control virtually all of the funding available to educate students at the local district level.
The last year has seen not only inaction, but also downright hostility, to school funding reform from elected officials in states across the country. In Arizona, Governor Doug Ducey continues to oppose a voter-approved ballot initiative that would generate $800 million for public education by raising taxes on top earners.[1] Legislators in Nevada have been dragging their feet in enacting a new school funding formula, despite more than a decade of research and advocacy pushing for a complete overhaul of their antiquated system.[2] Illinois lawmakers continue to provide only the bare minimum in annual formula increases. At this pace, vulnerable Illinois students will have to wait four decades for their schools to reach full and adequate funding.[3] The greatest obstacle to achieving equitable and adequate school funding continues to be the lack of political will in statehouses around the country to increase the level of investment in public education, made more compelling by the ever-mounting evidence that money matters.[4]
The stubborn resistance of many state governors and legislators to invest in the education of public school students begs the question: is it time for Congress to play a more active role in ensuring education equity and justice, especially for students in the nation’s high poverty, racially isolated districts and schools? Historically, the federal government has played a limited, but important, role in the effort to improve opportunities and outcomes for students, especially those from low-income households and students with disabilities. Federal funding through Title I, enacted as part of President Lyndon Johnson’s War on Poverty, distributes funding to schools and districts serving large percentages of students from low-income families. However, Title I represents less than 2% of the $764 billion spent on public education in the United States. Current dollars from Title I and other recurring federal sources are simply too small to improve the overall funding of public education in the states.
Furthermore, Congress provides federal education funding to all states without regard to whether their finance system is equitable and adequate, or whether the state is making the fiscal effort to invest in public education relative to its economic capacity. The allocation of federal aid to the states has the unintended consequence of facilitating and perpetuating patterns of under-funding and disinvestment in the education of our nation’s children. These federal dollars can, and must, be used as leverage to prod and push the states to enact transformative reforms in their finance systems.
Citing the deplorable conditions of public school finance documented in Making the Grade, President Joe Biden’s proposed fiscal year 2022 federal budget includes elements that could serve as a first step in long overdue reforms of the federal role in state school finance. The President is proposing a dramatic increase in Title I that would more than double the funds targeted to low-income students.[5] To do this, the administration is proposing $20 billion in new Title I Equity Grants to “address long-standing funding disparities between under-resourced school districts and their wealthier counterparts.”[6] These grants are premised on the undeniable fact that, in far too many states, federal funding “compensates for, rather than supplements an inequitable and inadequate base of State and local funds.”[7] These grants would require states to collect detailed data on the allocation of state and local funds to districts and schools, set goals and targets for closing funding gaps, and demonstrate progress towards improving equity and adequacy to be eligible for additional funding.
The state-by-state analysis in Making the Grade 2021 provides compelling justification for Congress to increase federal Title I funds to incentivize reform of state finance systems. The alarming inequities in many of those systems make clear that an increase in federal funds must go hand-in-hand with a commitment by state policymakers to undertake meaningful school funding reforms and boost investment in public education.

As documented in ELC’s report, From Courthouse to Statehouse – and Back Again, Kansas, New Jersey, Massachusetts, and Washington harnessed the power of litigation, legislation and advocacy to implement successful school funding reforms. These experiences provide important lessons for advocates seeking meaningful changes in how their schools are funded. The report notes that successful campaigns are multi-faceted and directed squarely at the elected members of state government; use strong and consistent messaging; and require long-term, sustained investment to maintain pressure and see reforms through.
More recently, California overhauled its school funding system by investing $18 billion in new state funds targeted to students who had been historically deprived of adequate resources. After decades of disinvestment, California had become one of the worst funded states in the country. Despite successful litigation challenging disparities in school funding, reactionary policies that limited property tax increases pushed the burden for funding to the state, but the state was not investing nearly enough. In addition, the way the money was distributed was overly complicated, overly restricted, and not well targeted to student needs. Districts had to deal with dozens of categorical grants that left them little power to decide how to spend funds.
In 2013, after years of research and negotiations, the Local Control Funding Formula (LCFF), a weighted student formula, was put in place. The new formula required about $18 billion in additional state funds, phased in over eight years. But the formula was fully funded ahead of schedule as a result of California’s strong economy. Between 2013 and 2019, California’s funding level rank rose from 41st in the nation to 32nd, and its funding distribution rank went from a flat 21st to 8th most progressive.
The LCFF ties district funding to student characteristics, with more funding for low-income students, English learners, and homeless and foster students. While districts have flexibility in how money is spent, they are required to spend certain funds on services for high-need students. Districts must implement local accountability plans that include community input and show how they will use formula funding to achieve local goals.
Researchers studied the early impact of state funding increases in California and found that, even in the first years of implementation, there were significant effects on student achievement. For every $1,000 increase in per pupil funding from the state, graduation rates increased by about 5 percentage points overall, and about 6 points for poor students. Improvements in graduation rates for Black students were slightly higher than for white students. The researchers also found significant improvements in math and reading, with students from low-income families seeing improvements in language arts scores that were more than double those of their more well-off peers.[8]
California’s road to school funding reform provides many lessons, including the need for diverse stakeholder engagement and a strong advocacy network.

In March 2020, when the COVID-19 pandemic hit the United States, a national spotlight was placed on the challenges facing America’s public education systems in the 50 states and the District of Columbia. School funding inequities became even more pronounced when the pandemic led to school closures, remote learning and an abundance of additional resource requirements to open and operate schools that could meet health and safety guidelines. Some of these challenges were novel: How could schools meet technology demands and provide virtual instruction for all students? Could schools obtain adequate cleaning supplies and personal protective equipment to keep students and staff safe? Other challenges were longstanding, though exacerbated by the pandemic: Were classrooms overcrowded? Were school facilities and ventilation systems safe? Did schools have enough nurses, social workers, and counselors to attend to students’ physical and social and emotional wellbeing?
To assist school districts across the country with the financial challenges of operating and reopening schools in the middle of a pandemic, Congress authorized an unprecedented $207 billion in Elementary and Secondary School Emergency Relief (ESSER) Funds.[9] ESSER funds were allocated using the Title I formula so that the money is targeted towards districts with higher poverty rates. And while these funds are one-time and non-recurring, some school districts are using the revenue to implement research-based interventions to address achievement gaps and improve learning with the hope that either state or federal support will continue beyond the current commitment. Such support is required to avoid a repeat of the fiscal cliff states faced after the federal funds used to prop up state education budgets during the 2008 Great Recession were depleted.[10][11]
The federal ESSER funds can be viewed as a “test-run” for increased federal support for schools. Policy experts have outlined the many ways that states and districts can use these federal dollars strategically to support critical investments, such as expanded learning time, early childhood education, community schools, and supporting the educator pipeline.[12] It is imperative that states and districts use this opportunity to document the successful expansion and implementation of new programs to accelerate learning and close achievement gaps that may have widened during the pandemic.
How Fair is School Funding in Your State?
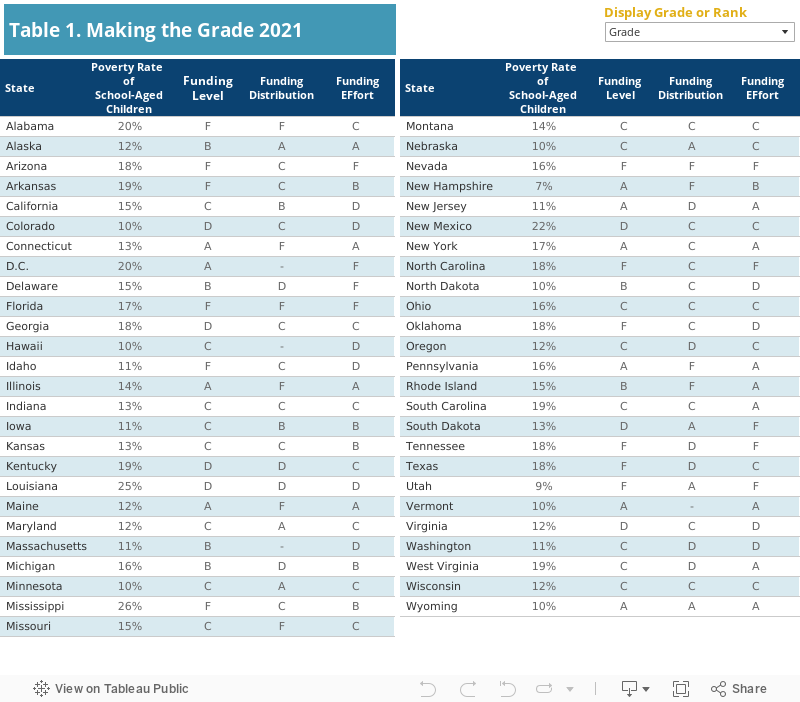
Making the Grade analyzes the condition of public school funding in all 50 states and the District of Columbia. Using the most recently available data from the 2018-19 school year, the report ranks and grades each state on three measures to answer the key question: How fair is school funding in your state?
The three fairness measure are:
- Funding Level – cost-adjusted, per-pupil revenue from state and local sources (Fig. 1);
- Funding Distribution – the extent to which additional funds are distributed to school districts with high levels of student poverty (Fig. 2);[13]
- Funding Effort – funding allocated to support PK-12 public education as a percentage of the state’s
economic activity (GDP) (Fig. 3).
The state rankings and grades on these measures provide crucial data to inform advocates, policymakers, business and community leaders, teachers, parents and students about the equity and adequacy of public school funding in their state. Making the Grade is designed to assist state residents working to improve the level and distribution of funding for public school students.
What is Fair School Funding?
We define fair school funding as the funding needed in each state to provide qualified teachers, support staff, programs, services, and other resources essential for all students to have a meaningful opportunity to achieve a state’s academic standards and graduate from high school prepared for citizenship, postsecondary education and the workforce. A fair funding system is the basic foundational building block for high-performing, effective, PK-12 public school systems. Fair funding has two basic components: a sufficient level of funding for all students and increased funding for high-poverty districts to address the additional cost of educating students in those districts. These two components are dependent on a third: the effort made by state legislatures to provide sufficient revenue to support the public school system.
Why the States?
Unlike other countries, the U.S. has no national education system. Instead, states, under their respective constitutions, have the legal obligation to support and maintain systems of free public schools for all resident children. This means that the state, and not local districts, is the unit of government in the U.S. legally responsible for operating the nation’s public school systems and providing the funding necessary to support and maintain those systems.
All states fund their schools through a statewide method or formula enacted by the state legislature. These school funding formulas, or school finance systems, determine the amount of revenue school districts are permitted to raise from local property and other taxes and the amount of funding or aid the state is expected to contribute from state taxes. In annual or biannual state budgets, legislatures also determine the actual amount of funding districts will receive to operate their schools. Several states, including New Jersey, New York, and Illinois, fail to provide in their budgets the amount of state aid required by the state’s own funding formula, a condition called formula underfunding.
State and local revenues account for, on average, approximately 92% of total funding for public education. The federal government, primarily through programs targeted for low-income students and students with disabilities, contributes the remaining 8%.[14]
Why Does Fair School Funding Matter?
A fair, equitable and adequate school funding formula is the basic building block of a well-resourced and academically successful school system for all students. A strong funding foundation is even more critical for low-income students, English learners, students with disabilities, and students facing homelessness, trauma and other challenges. These students, and the schools that serve them, need additional staff, programs and supports to put them on the same footing as their peers. Research on the need of vulnerable student populations for extra academic and academically related programs and services is compelling, as is growing evidence that increased investments in these students improves their achievement and other outcomes.[15]

This report utilizes national data sets to analyze the condition of school funding in the states.
Data Sources The U.S. Census Bureau’s Annual Survey of School System Finances (2019), the U.S. Census Bureau’s Small Area Income and Poverty Estimates (2019), and the U.S. Bureau of Economic Analysis’ State Gross Domestic Product reports (2019).
Funding Level is determined by dividing state and local revenue by student enrollment. Federal revenue is not included, except for Impact Aid and American Indian education revenue, as they are intended to replace state and local funds. We also exclude revenue for capital outlay and debt service programs. These revenues tend to be uneven from year to year, and one-time or short-term investments may obscure more prevalent funding patterns. Finally, district-level payments to charter schools reported as expenditures are subtracted from the revenue total as these revenues are attributable to students not included in the enrollment count.[16] The resulting per-pupil funding levels are adjusted for regional differences using the National Center for Education Statistics’ Comparable Wage Index for teachers.
Funding Distribution utilizes a modified version of the regression-based method developed by Bruce Baker and published in Is School Funding Fair? A National Report Card (eds 1-7) to model the pattern of funding relative to district poverty within each state.[17] The analysis essentially asks, once differences in costs related to district size and geography are accounted for, do states provide more or less funding to districts as the poverty rate increases? Using district-level revenue data (as defined above for funding level), the model predicts funding in a high-poverty (30% Census poverty) relative to a low-poverty (5% Census poverty) district. States that provide higher per-pupil funding levels to high-poverty districts are progressive; states that provide less to high-poverty districts are regressive; and states where there is no meaningful difference are flat.
Funding Effort is measured as total state and local revenue (including capital outlay and debt service, excluding all federal funds) divided by the state’s gross domestic product (GDP). GDP is the value of all goods and services produced by each state’s economy and is used here to represent the state’s economic capacity to raise funds for schools.
Grades are assigned using the typical curve. A standardized score is calculated as the state’s difference from the mean or average, expressed in standard deviations. Grades are as follows: A = 2/3 standard deviation above the mean; B = between 1/3 and 2/3 standard deviations above the mean; C = between 1/3 standard deviation below and 1/3 standard deviation above the mean; D = between 1/3 and 2/3 standard deviations below the mean; F = 2/3 standard deviation below the mean.
For more details on report methodology, see the Technical Appendix.
Funding Level
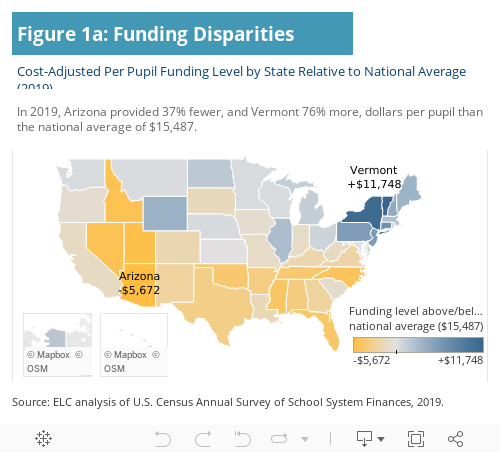
A state’s funding level is measured by analyzing the combined state and local revenues provided through the state school finance formula, adjusted to account for regional variations in labor market costs.
A state’s funding level grade is determined by ranking its position relative to other states the grade does not measure whether a state meets any particular threshold of funding level based on the actual cost of education resources necessary to achieve state or national academic standards.
Figure 1 shows the extreme divergence in school funding levels across states, even after adjusting for regional cost differences, with the top states providing upwards of 50% more and the bottom states providing 30% less than the national average funding level of $15,487 per-pupil. Figure 1a shows a clear geographic pattern, with states in the Northeast and Midwest generally having higher funding levels than those in the South and West.
Funding Distribution
The hallmark of a fair school funding system is that it delivers more funding to educate students in high-poverty districts. This means states providing equal or less funding to high-poverty districts are shortchanging the students most in need of additional resources for academic success. A central feature of fair school funding is providing higher levels of funding to districts serving large concentrations of students from households with incomes below the federal poverty line.
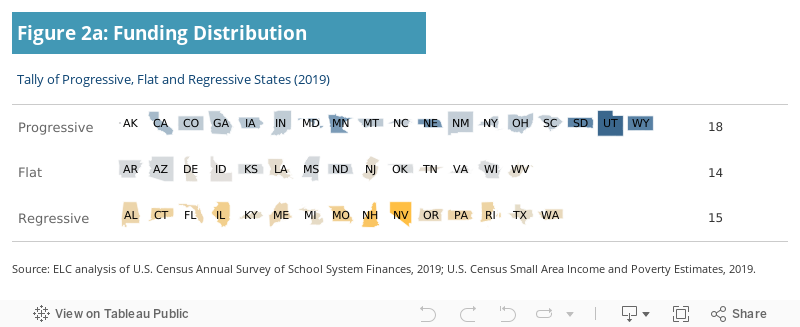
Figure 2 depicts funding distribution in each state as measured by the funding allocated to high-poverty districts relative to low-poverty districts.[18] States allocating more per-pupil funds to high-poverty districts have a “progressive” distribution system, resulting in a higher grade on the funding distribution measure. States that do the opposite have a “regressive” distribution system and earn a lower grade. States with similar funding levels in high- and low-poverty districts have “flat” distribution systems, clustered in the “C” grade range.
As with funding level, states are highly divergent in terms of the progressivity of their funding distribution. Utah and Alaska provide 57% more, and Nevada provides 32% less, funding to high-poverty districts than to low-poverty districts. (Fig. 2)
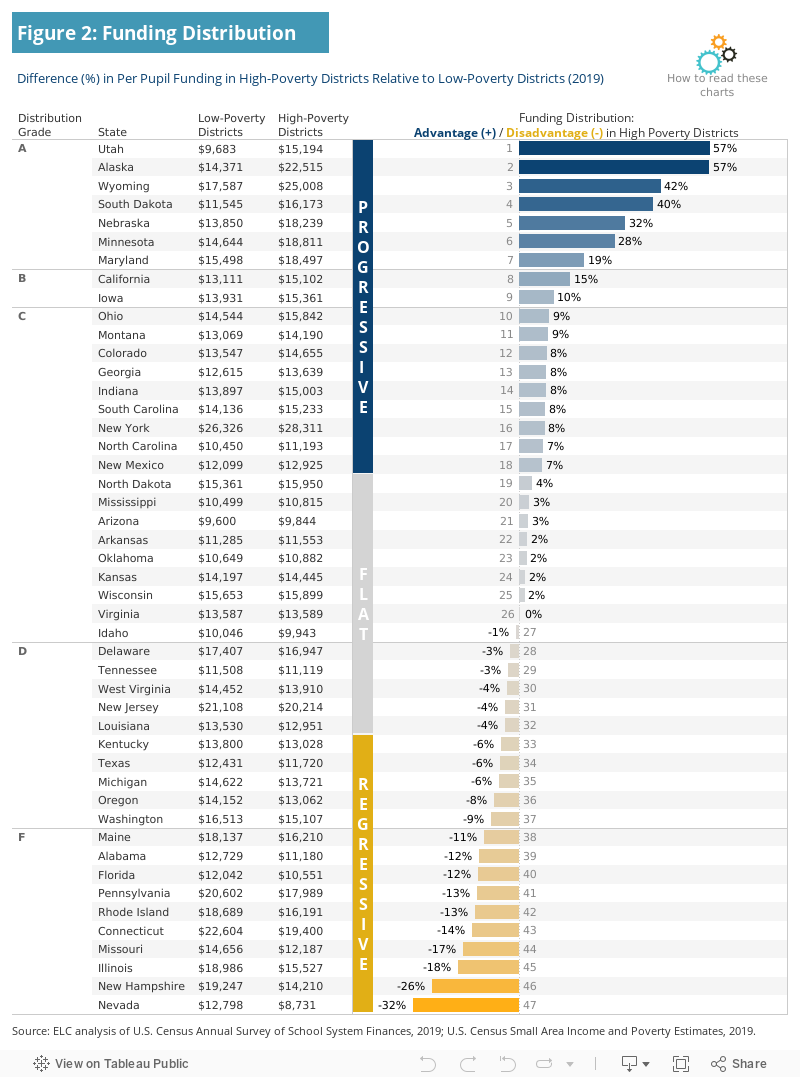
Only 18 states have even modestly progressive school funding systems with at least 5% more funding, on average, in high-poverty districts. School funding is flat (+/-5%) in 14 states, meaning there is no appreciable increase in funding to address the need for additional resources in high-poverty districts. The remaining 15 states have regressive funding systems. (Fig. 2a)
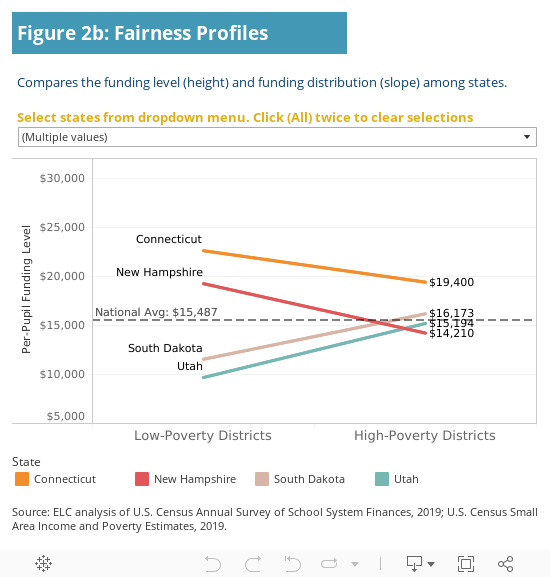
Funding Distribution v. Funding Level
Funding progressivity must be placed within the context of overall funding levels. The potential for progressive funding to adequately resource a state’s high-poverty schools is difficult if the overall level of funding is extremely low.
For example, both Utah and South Dakota have progressive funding systems, but low funding levels. (Fig. 2b) As a result, even the highest poverty districts in those states are funded at the overall national average, which is unlikely to provide the opportunities and resources those students need. Likewise, well-funded states with regressive distribution will struggle to close persistent achievement gaps. States such as Connecticut and New Hampshire may initially appear to be well-resourced, but the disparity in funding between their highest and lowest poverty districts means the highest poverty districts will always struggle to provide comparable opportunities to their students.
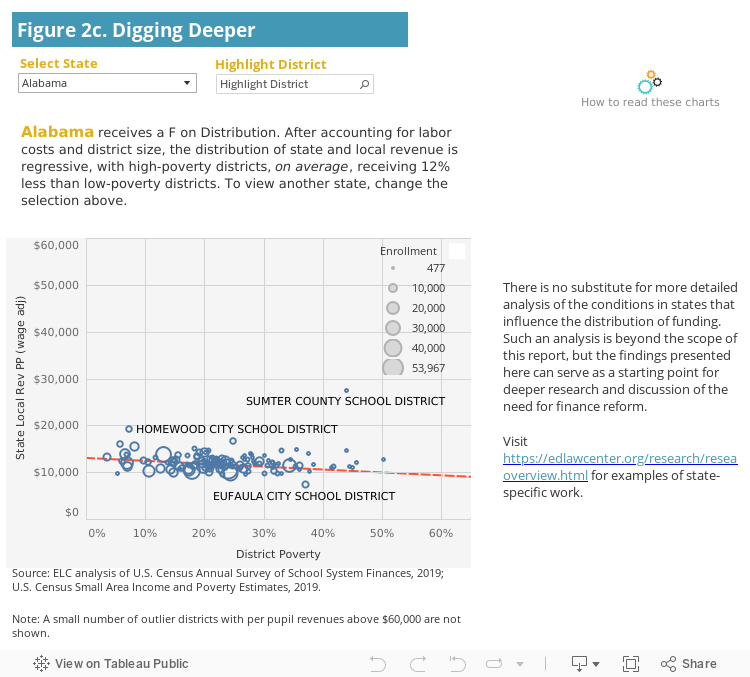
Digging Deeper
The funding distribution measure uses district-level data to determine a state’s overall pattern of school funding. It is important to recognize that this measure may not capture the variations in a complex system. There will inevitably be outlier districts in some states that do not match the statewide pattern we presented here (e.g., the presence of poorly funded, high-poverty districts in an otherwise progressive state). Figure 2c illustrates both the wage-adjusted district level data (blue circles) and the estimated relationship between funding and poverty in the state (red line). This graph provides important context as to how well individual districts fit the overall state pattern.
Funding Effort
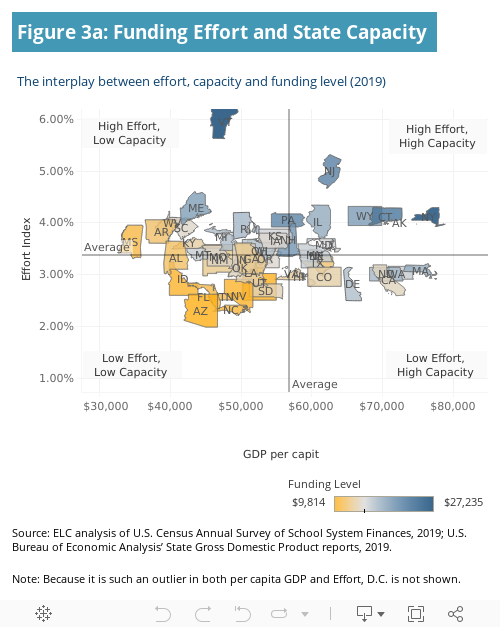
Figure 3 ranks states on effort as measured by the percentage of the state’s economic activity, or gross domestic product (GDP), allocated to support the PK-12 school system.[19] Depending on a state’s overall wealth, every tenth of a percent (0.1%) of state GDP invested in PK-12 public education can have a big impact. For example, that figure is $34 million in Vermont, the nation’s smallest economy, and up to $3 billion in California, the nation’s largest. Figure 3 juxtaposes a state’s relative effort (compared to the national average) with its per capita GDP to contextualize how the effort index interacts with the state’s relative wealth to produce high or low funding levels.
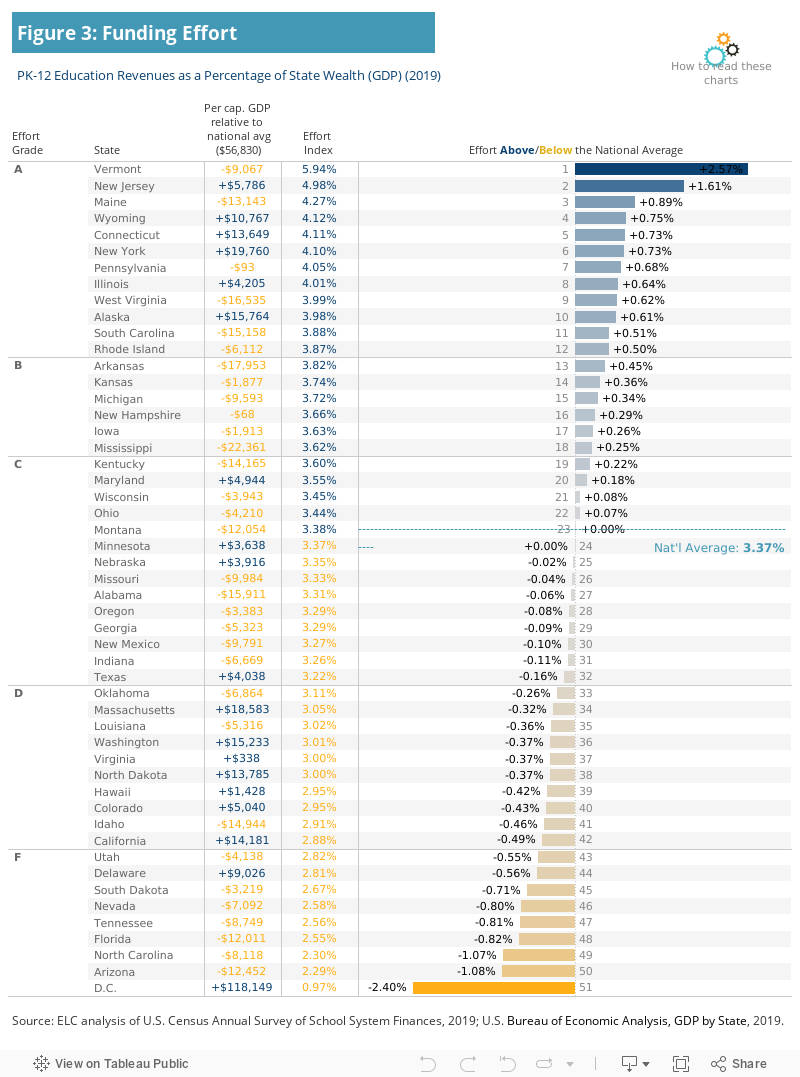
Figure 3a depicts the interplay between funding effort, a state’s fiscal capacity (as measured by GDP per capita), and funding levels. With a few exceptions, most of the states with high funding levels (colored blue) are high-effort states. But by no means are all high-effort states well-funded. The red states in the top left quadrant are high-effort, low-capacity states where additional federal interventions might be necessary to increase funding levels. Mississippi and Arkansas, for example, are states with slightly above average effort but are also the two poorest states in the country.
The below-average-effort states in the bottom half of the chart also have mostly below-average funding levels, but they are in a better position to increase funding with state policy changes that prioritize education funding. The higher-capacity states on the right, such as Colorado and California, may be able to significantly raise funding by increasing their effort, perhaps with some federal incentive to spur action. The low-capacity states on the left, such as Idaho and Nevada, would need even greater federal support.
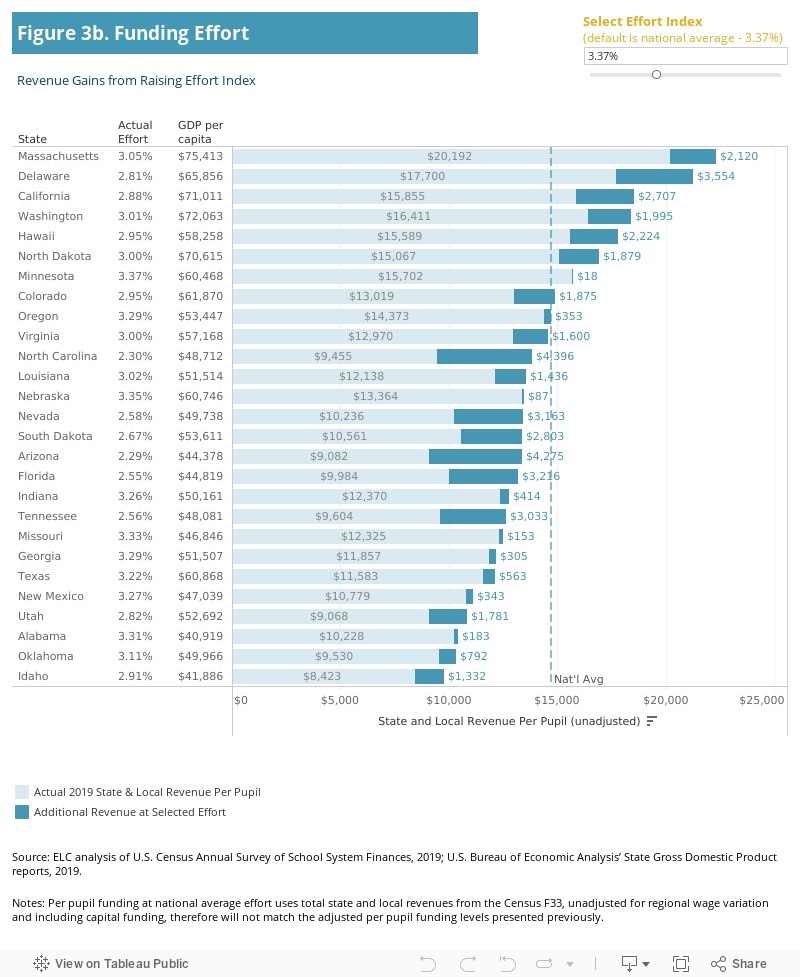
To put this in context, Figure 3b estimates the per-pupil funding levels achieved by bringing below-effort states up to the national average effort index, a modest benchmark. Many of the low-effort, low-capacity states could significantly increase funding by increasing effort. North Carolina, Arizona, Nevada, Florida, and Tennessee could all increase funding by more than $3,000 per-pupil, though most would still fall far short of national average funding levels. Other states, such as Idaho, Oklahoma, and Alabama would still fall far below average funding levels.
Using Federal Spending Power to Secure State Funding Reform
Making the Grade 2021 once again documents the prevalence and persistence of unfair school funding practices across the country. It is clear that real, systemic change is needed in many states, and that change must come from state policies that are the overwhelming drivers of how public school funds are allocated. As mentioned above, President Biden’s proposal to increase Title I funding by offering states “equity grants” tied to improving their school finance systems is, if enacted by Congress, an important first step in using federal spending power to leverage changes in the underlying condition of school finance in the states. School finance experts have also recently offered their own proposals for how the federal government could effectively expand its role. For example, researchers at the Brookings Institute found that Black-white and economically disadvantaged-advantaged funding gaps were about $400 per-pupil, while Hispanic students receive nearly $1,200 less than white peers.
They show that most of the funding gaps are attributable to differences in between-state funding and the likelihood that historically marginalized groups are overrepresented in the lowest funded and/or least progressive states.[20] One proposed policy solution, focusing on supplementing state and local funds, is to target additional Title I funding to create parity with white or economically advantaged spending or, more ambitiously, to increase subgroup spending to the 75th or 90th spending percentiles nationally, which would provide the additional funding needed to compensate for historical inequities.[21] The estimated price tag to eliminate the gaps between poor and nonpoor students would be around $40 billion annually, while it would cost over $85 billion to reach spending at the 75th percentile.
The concern with using Title I to reduce or eliminate state funding gaps is that it lets states off the hook for improving funding equity and adequacy in their finance formulas. It could also lead to a reduction of effort in states that receive the greatest federal support.
A recent proposal from the Center for American Progress for “Public Education Opportunity Grants” would leverage federal funds for improvements in the equity and adequacy of funding at the federal, state, and local levels.[22] The plan would roughly double per-pupil funding for students living in poverty, on top of existing Title I dollars. The novelty of this plan lies in the criteria under which districts are eligible for funds. In states that are regressive – where poor districts receive less funding than wealthy districts – only the highest poverty districts would be eligible for grants. In progressive states, funding is contingent on state wealth and effort. For example, all districts would be eligible in states with low wealth and high effort, while only the highest poverty districts would be eligible in moderate or high wealth states with low effort.
But would states refuse to engage in meaningful school funding reform, even if they risked losing federal funds? Here, we end up where we started: the urgent need to build political support in state capitols so that lawmakers and governors commit to school funding reform and greater investments in public education. The obligation to provide, maintain and support public education rests primarily with the states, by virtue of the affirmative duties spelled out in their constitutions. Public education has historically been, and remains today, the ultimate “state’s right,” debated every year in state legislative sessions across the country. Only sustained political campaigns focused on strengthening public education can change the trajectory in states that, for decades, shortchanged students of an adequate education. Public education advocacy can also provide the crucial support needed to compel Congress to enact reforms designed to employ the full weight of federal spending power in the service of preparing the nation’s children for their role as citizens, voters and contributors to our economic well-being.

As part of the Affordable Care Act (ACA), President Obama’s overhaul of the U.S. healthcare system, states had the opportunity to opt in to an expansion of Medicaid, the federal and state program that covers healthcare costs for people with low incomes. Under expansion, states must raise the income eligibility threshold to 138% of the federal poverty line. Medicaid Expansion uses an incentive model, where states receive a 90% federal match for adults covered through expansion, a rate higher than the rate for other Medicaid recipients, which ranges from 50-78%.[23]
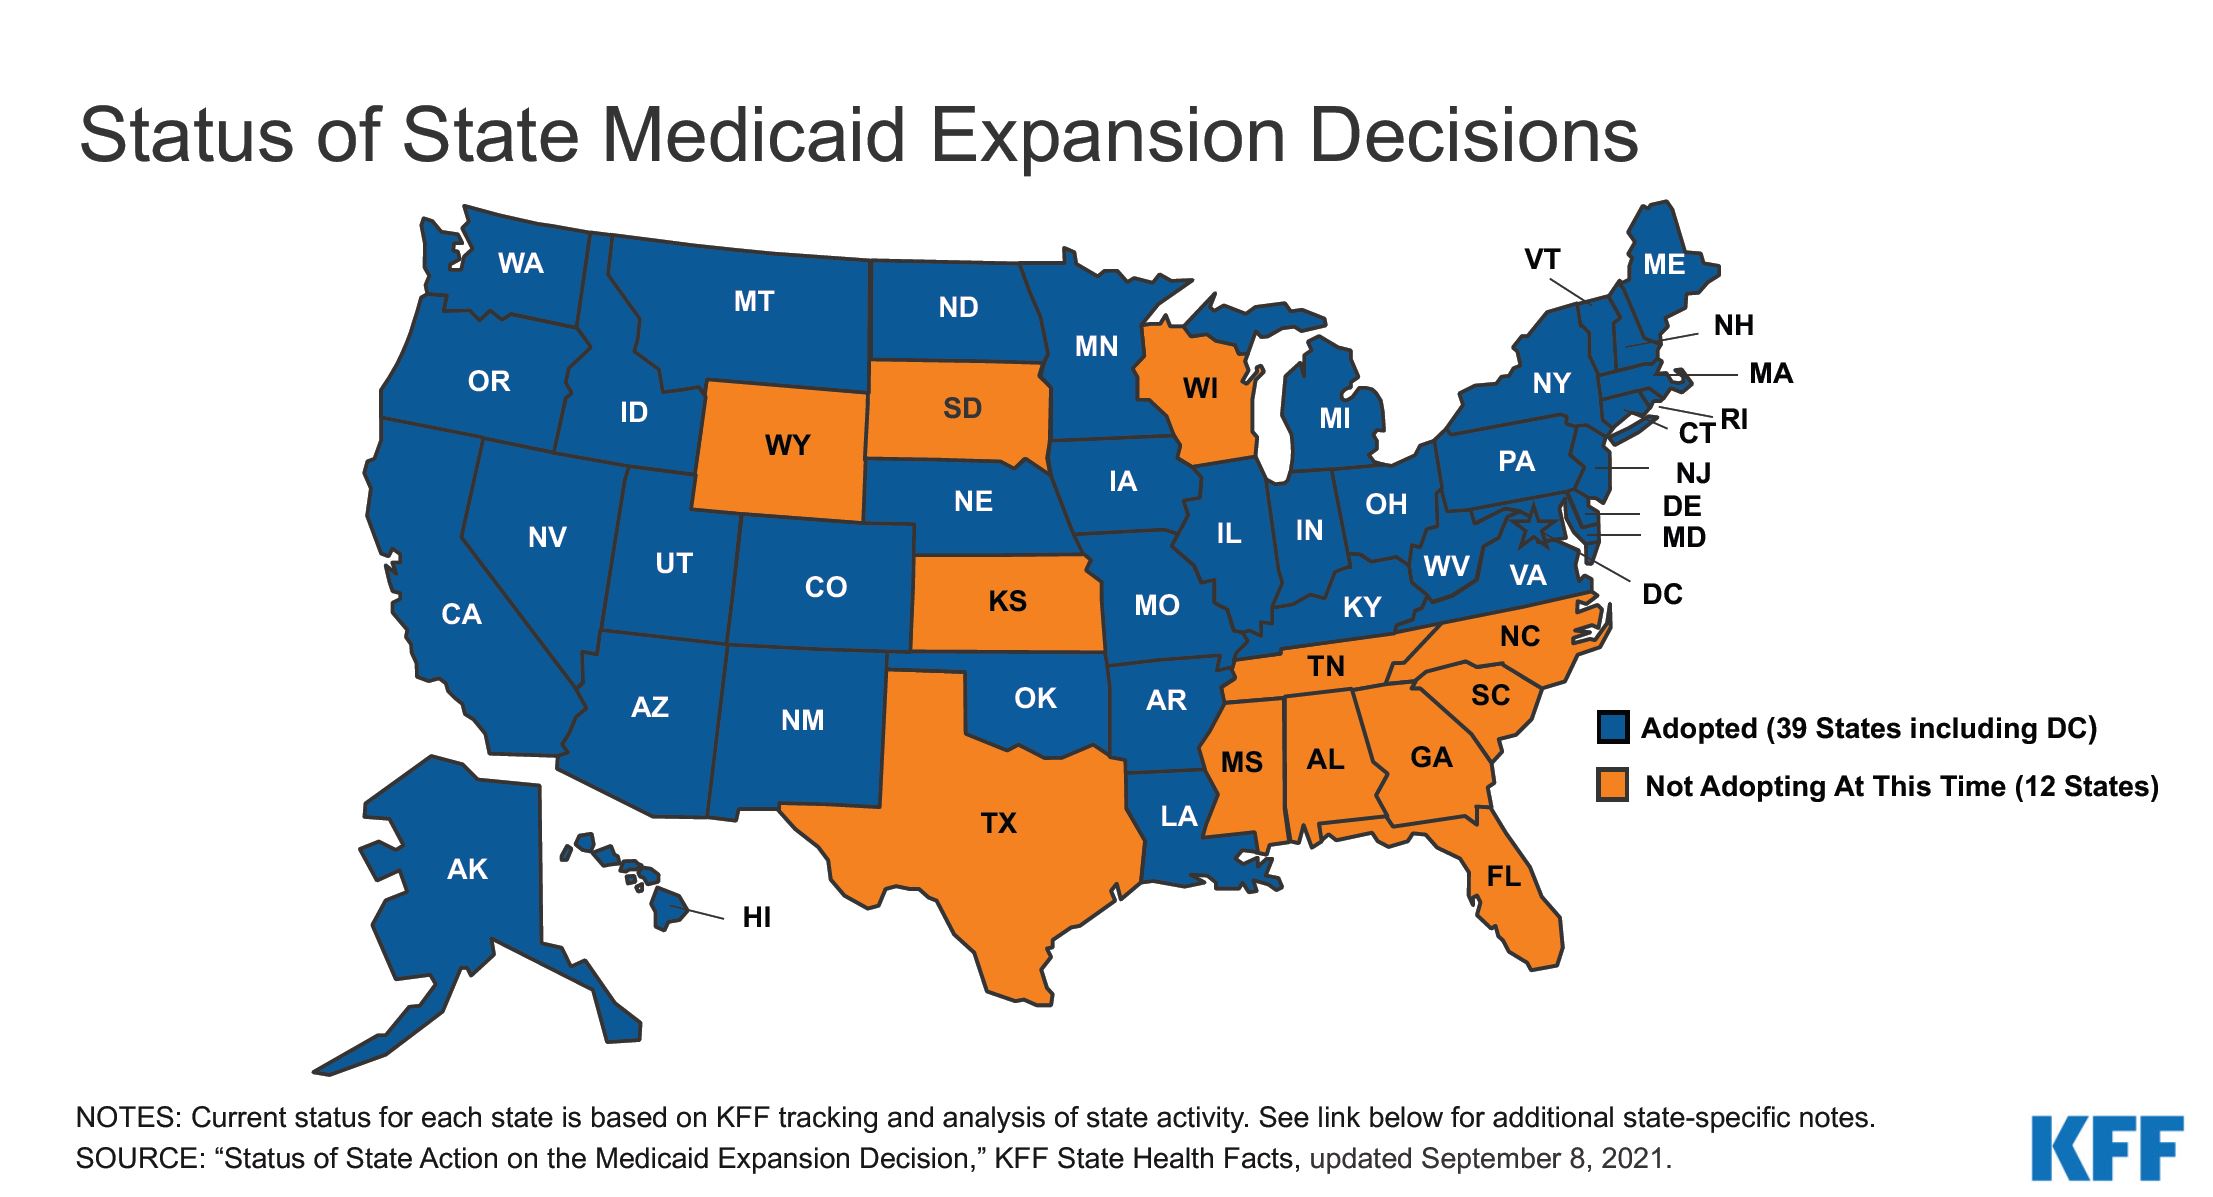
As of August 2021, 12 states – mostly located in the South and Great Plains – have yet to adopt Medicaid Expansion. While some offer fiscal excuses for their reluctance to participate, research suggests that expansion pays for itself through cost savings and economic growth.[24] Of course, there are wide-ranging benefits of improved coverage, such as greater access to regular and preventative health care, the narrowing of racial and ethnic health disparities, and being better positioned to weather a public health crisis, such as the COVID-19 pandemic.[25]
Some argue that the lack of participation is largely ideological, with red-state resistance to “Obamacare” and federal intervention in “states’ rights” dominating the discourse.[26] These political decisions contradict prevailing public opinion in which support for Medicaid is growing. In fact, a survey of residents in the 14 states that had not expanded by 2020 showed that 61% favored expansion, and in several of the late-adopter states popular ballot initiatives drove expansion.[27]
Any attempt at an incentive-based expansion of Title I funding will face many of the same obstacles. Title I equity grants would use additional federal funding to spur states to increase state education funding and improve equity. The problem is states that are most in need of federal intervention are the most likely to object to such strings, and may, as with Medicaid, forgo additional dollars. Similar to health care, this decision would prevent these states from sharing in the long-term benefits that would come from greater investment, such as improved educational outcomes, reduced racial disparities, and economic growth.[28] Resistance is also likely to come from the very states most in need of federal help: the low-capacity, poorly funded states in the South.
But, like healthcare, public education has a high level of support in public opinion polling. A National School Boards survey of likely 2022 voters found a majority had positive perceptions of their own schools, and 59% support increasing school funding.[29] For 19 years in a row, the PDK poll of public attitudes finds that lack of financial support is the number one problem facing public schools.[30]
If Title I Equity Grants are funded, and if they require states to opt in, Medicaid Expansion can offer a roadmap for education advocates, who may need to push their states to participate. Healthcare advocates led successful ballot initiatives for expansion in six red states (Maine, Idaho, Nebraska, Utah, Oklahoma, and Missouri), and three more are expected in 2022 (Florida, Mississippi, and South Dakota).[31] These success stories give hope that effective advocacy and the democratic process can prevail over misguided politics.
Endnotes
[1] Welch, Dennis. “Ducey outlines approach to sink voter-passed Prop.208 which funds education.” Arizona’s Family, March 23, 2021, https://www.azfamily.com/news/politics/arizona_politics/ducey-outlines-approach-to-sinkvoter-passed-prop-208-which-funds-education/ article_501aa808-8c3e-11eb-828a-67f95f370731.html
[2] McKillip, Mary and Danielle Farrie. Nevada’s New Formula is an Opportunity Not to Be Lost. Education Law Center, June 2020, https://edlawcenter.org/research/nevada/nevada-funding-formula.html
[3] Flanagan, Allison and Ralph Martire. Fully Funding the Evidence-Based Formula: FY 2022 Proposed General Fund Budget Update. Center for Tax and Budget Accountability, March 16, 2021, https://www.ctbaonline.org/reports/fully-funding-ebf-volume-iii
[4] McKillip, Mary and Theresa Luhm. Investing Additional Resources in Schools Serving Low-Income Students. Education Law Center, April 2020, https://edlawcenter.org/assets/files/pdfs/publications/Investing_in_Students_Policy_Bri.pdf
[5] U.S. Department of Education. Fiscal Year 2022 Budget Summary, pg. 6, https://www2.ed.gov/about/overview/budget/budget22/index.html
[6] U.S. Department of Education. Education for the Disadvantaged, Fiscal Year 2022 Budget Request, pg. 22, https://www2.ed.gov/about/overview/budget/budget22/justifications/a-ed.pdf
[7] Ibid., pg. 24
[8] Rucker C. Johnson and Sean Tanner. Money and Freedom: The Impact of California’s School Finance Reform, Learning Policy Institute, February 2018, https://learningpolicyinstitute.org/sites/default/files/product-files/Money_Freedom_CA_School_Finance_Reform_BRIEF.pdf
[9] U.S. Department of Education, Office of Elementary & Secondary Education. Elementary and Secondary School Emergency Relief Fund, https://oese.ed.gov/offices/education-stabilization-fund/elementary-secondary-school-emergency-relief-fund/
[10] Sciarra, David, Danielle Farrie and Bruce Baker. Filling Budget Holes: Evaluating the Impact of ARRA fiscal Stabilization Funds on State Funding Formulas. The Campaign for Educational Equity, Teachers College, January 26, 2010, https://edlawcenter.org/assets/files/pdfs/publications/133_FILLINGBUDGETHOLES.pdf publications/133_FILLINGBUDGETHOLES.pdf
[11] Leachman, Michael, Kathleen Masterson and Eric Figueroa. A Punishing Decade for School Funding. Center on Budget and Policy Priorities, November 29, 2017, https://www.cbpp.org/research/state-budget-and-tax/a-punishing-decade-for-school-funding
[12] Learning Policy Institute. How Can States and Districts Use Federal Recovery Funds Strategically?, July 7, 2021, https://learningpolicyinstitute.org/federal-funds-factsheets
[13] This measure does not include figures for Hawaii and the District of Columbia which operate as single district systems. Vermont and Massachusetts are also excluded because of reporting inconsistencies. See the Technical Appendix for more information, available at https://edlawcenter.org/assets/MTG%202020/TechnicalAppendix21.pdf
[14] Chen, Erika. “K-12 School Spending up 4.7% in 2019 From Previous Year.” U.S. Census Bureau, America Counts, May 18, 2021, https://www.census.gov/library/stories/2021/05/united-states-spending-on-public-schools-in-2019-highest-since-2008.html
[15] McKillip, Mary and Theresa Luhm. Investing Additional Resources in Schools Serving Low-Income Students. Education Law Center, April 2020, https://edlawcenter.org/assets/files/pdfs/publications/Investing_in_Students_Policy_Bri.pdf
[16] The variables used to construct the per-pupil state and local revenue totals for districts has been modified in this report to reflect reporting inconsistencies related to charter schools. In some states, districts receive state and local revenue to support charter students, but those students are not included in enrollment totals, resulting in an inflation of per-pupil revenue. To correct this, district-level payments to charter schools reported as expenditures are subtracted from the revenue total. For more detail, see the Technical Appendix.
[17] Baker et al., Is School Funding Fair? A National Report Card (eds 1 -7) available at www.schoolfundingfairness.org.
[18] Poverty is measured using the Census definition due to reporting inconsistencies for the National School Lunch Program, the more commonly used metric of school poverty. Census poverty is a more severe measure than either free lunch (130% of Census poverty) or reduced lunch (185%) eligibility. We define high-poverty districts as having a 30% Census poverty rate among school-aged children and low-poverty districts having a 5% poverty rate. For more detail, see the Technical Appendix.
[19] Gross domestic product (GDP) is the value of all goods and services produced by each state’s economy. In this report is serves as a measure of each state’s capacity to raise revenue to fund schools.
[20] Shores, Kenneth, Hojung Lee and Nell Williams. Increasing Title I funds should target largest sources of school spending inequalities – across states. Brown Center Chalkboard, Brookings Institute, August 6, 2021, https://www.brookings.edu/blog/brown-center-chalkboard/2021/08/06/increasing-title-i-funds-should-target-largest-sources-of-school-spending-inequalities-across-states/
[21] Shores, Kenneth, Hojung Lee and Nell Williams. Expanding Title I could eliminate K-12 spending gaps – if the funds are well targeted. Brown Center Chalkboard, Brookings Institute, August 19, 2021, https://www.brookings.edu/blog/brown-center-chalkboard/2021/08/19/expanding-title-i-could-eliminate-k-12-spending-gaps-if-the-funds-are-well-targeted/
[22] Sargrad, Scott et al. Public Education Opportunity Grants. Center for American Progress, October 8, 2020, https://www.americanprogress.org/issues/education-k-12/reports/2020/10/08/491255/public-education-opportunity-grants/
[23] Cross-Call, Jesse and Matt Broaddus. States That Have Expanded Medicaid Are Better Positioned to Address COVID-19 and Recession. Center for American Progress, July 14, 2020, https://www.cbpp.org/research/health/states-that-have-expanded-medicaid-are-better-positioned-to- address-covid-19-and
[24] Simpson, Michael. The Implications of Medicaid Expansion in the Remaining States: 2020 Update. Urban Institute, June 2020, https://www. urban.org/sites/default/files/publication/102359/the-implications-of-medicaid-expansion-in-the-remaining-states-2020-update_0.pdf
[25] Bachrach, Deborah et al. Finishing the Job of Medicaid Expansion. State Health & Value Strategies, Princeton University, January 26, 2021, https://www.shvs.org/finishing-the-job-of-medicaid-expansion/
[26] Editorial Board. “States Have No Good Reason for Refusing to Expand Medicaid.” Bloomberg, April 2, 2021, https://www.bloomberg.com/opinion/articles/2021-04-02/there-s-no-good-reason-for-states-to-refuse-to-expand-medicaid
[27] Bachrach, Deborah et al. Finishing the Job of Medicaid Expansion. State Health & Value Strategies, Princeton University, January 26, 2021, https://www.shvs.org/finishing-the-job-of-medicaid-expansion/
[28] Institute for Policy Research, The Benefits of Increased School Spending. Northwestern, March 2017, https://www.ipr.northwestern.edu/documents/policy-briefs/school-spending-policy-research-brief-Jackson.pdf
[29] “National Poll Shows Voters Strongly Support Public Schools.” National School Boards Action Center, https://nsbac.org/2021-poll/
[30] PDK Poll. Public School Priorities in a Political Year, September 2020, https://pdkpoll.org/wp-content/uploads/2020/08/Poll52-2020_PollSupplement.pdf
[31] Brown, Christopher. “Medicaid Expansion Ballot Measures Brewing in Three More States.” Bloomberg Law, January 26, 2021, https://news.bloomberglaw.com/health-law-and-business/medicaid-expansion-ballot-measures-brewing-in-three-more-states