Introduction
In the decade following the Great Recession, students across the U.S. lost nearly $600 billion from the states’ disinvestment in their public schools. Data from 2008-2018 show that, if states had simply maintained their fiscal effort in PK-12 education at pre-Recession levels, public schools would have had over half a trillion dollars more in state and local revenue to provide teachers, support staff and other resources essential for student achievement. Further, that lost revenue could have significantly improved opportunity and outcomes for students, especially in the nation’s poorest districts.
The states dramatically reduced their investment in public education in response to the 2007 Great Recession. Yet as economies rebounded, states failed to restore those investments. As our analysis shows, while states’ economic activity — measured as Gross Domestic Product (GDP) — recovered, state and local revenues for public schools lagged far behind in many states.
This “lost decade” of state disinvestment has put public schools in an extremely vulnerable position as the nation confronts the coronavirus pandemic. Once again, state budgets are strained by declining revenues. And once again, school districts across the country are bracing for state aid cuts and the potential for reduced local support.
This report builds on our Making the Grade analysis of the condition of public school funding in the 50 states and the District of Columbia. Instead of a one-year snapshot, this report provides a longitudinal analysis of the effort made by states from 2008 to 2018 to fund their public education systems. We measure that effort using an index that calculates elementary and secondary education revenue as a percentage of each state’s economic activity or GDP.
A key goal of this report is to give advocates data and information to use in their efforts to press governors and state legislatures not to make another round of devastating “pandemic cuts” to already underfunded public schools.
Even as economies rebounded after the Great Recession, state legislatures chose not to reinvest in public education.
Impact of the Great Recession on School Funding
In 2007, the Great Recession caused a sharp decline in the state and local tax revenues that support public schools. States mitigated cuts to public education with a one-time federal stimulus program: the State Fiscal Stabilization Fund (SFSF) under the American Reinvestment and Recovery Act (ARRA). But many states were left with large, structural deficits in their education budgets when the one-time federal funds dried up.[1] Because states are legally required to have balanced budgets, these deficits, coupled in some states with tax cuts, triggered a cycle of deep and painful reductions in state support for K-12 public education across the country.[2]
While it may not be surprising that states reduced support for public education in response to the Recession, what could not be anticipated was their failure to reinvest in public education as their economies began to improve. Nationally, inflation-adjusted GDP increased by 17% between 2008 and 2018, while state and local revenues for PK-12 schools increased by only 6% (Fig. 1).
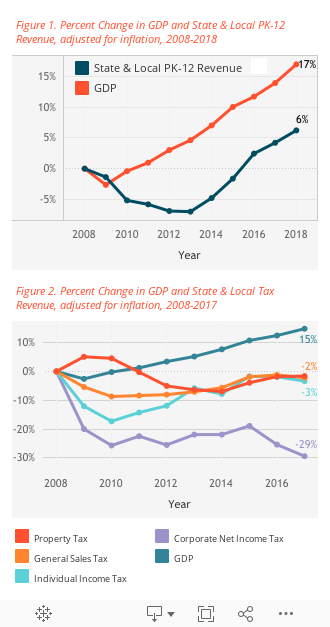
Economic recovery in the states as measured by GDP does not necessarily translate into available revenue for public education. State tax policies determine the degree to which revenue is collected from increased economic activity. Nationally, inflation-adjusted GDP grew 15% between 2008 and 2017, but the tax sources typically used to fund education – sales and income tax from the state and property taxes from local jurisdictions – were still below 2008 levels (Fig. 2). In all but four states, GDP was back at 2008 levels, but 19 states collected less in property taxes, 30 collected less in sales tax, and 35 collected less in individual income taxes, after adjusting for inflation.
Shrinking or stagnant tax revenues are largely the result of policies adopted by the elected branches of state government. The political dynamics in state capitols have profound implications for the level and distribution of school funding. Nationally, state sources (mainly sales and income tax) provide 47%, and local sources (overwhelmingly from property taxes) provide 45% of the revenue to support public schools. The federal government contributes the remaining 8%. When state governments allow tax revenues to decline or remain stagnant, public schools, which states are legally obligated to maintain and support, pay the price. Elementary and secondary education on average accounts for 36% of states’ general fund spending, the most of any state government services.[3] The bottom line is this: in 2018, economic activity had surpassed pre-Recession levels in all but nine states. Yet a decade after the Great Recession, most states were making less effort to fund their schools than before the Recession first hit school budgets.
The Dramatic Plunge in State Funding Effort
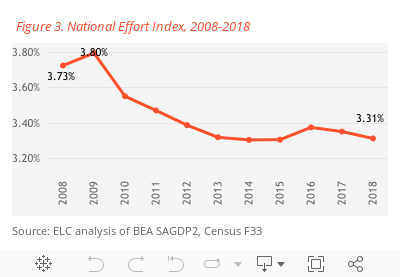
The results of state disinvestment in education are alarming: PK-12 education revenues in 2018 represented 3.31% of the states’ combined GDP, a substantial drop from 2008’s 3.73% (Fig. 3).[4] The effort index in 2018 was as low as it had been over the entire 2008-2018 period.
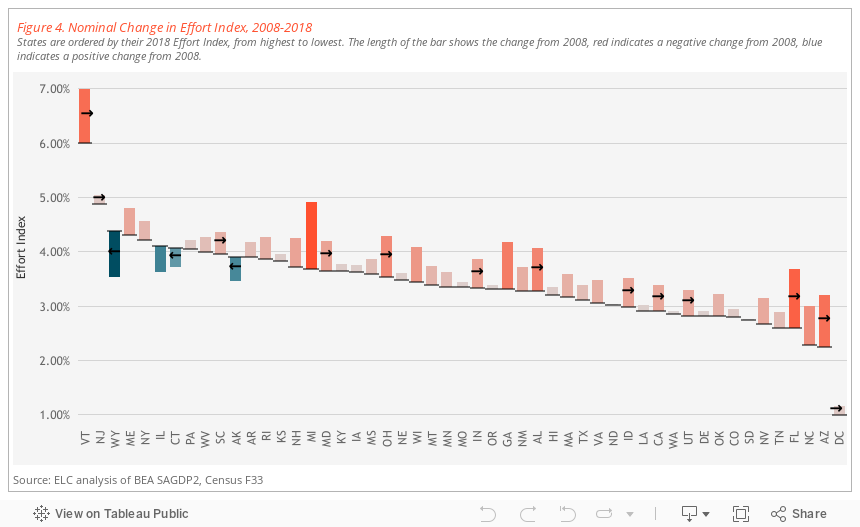
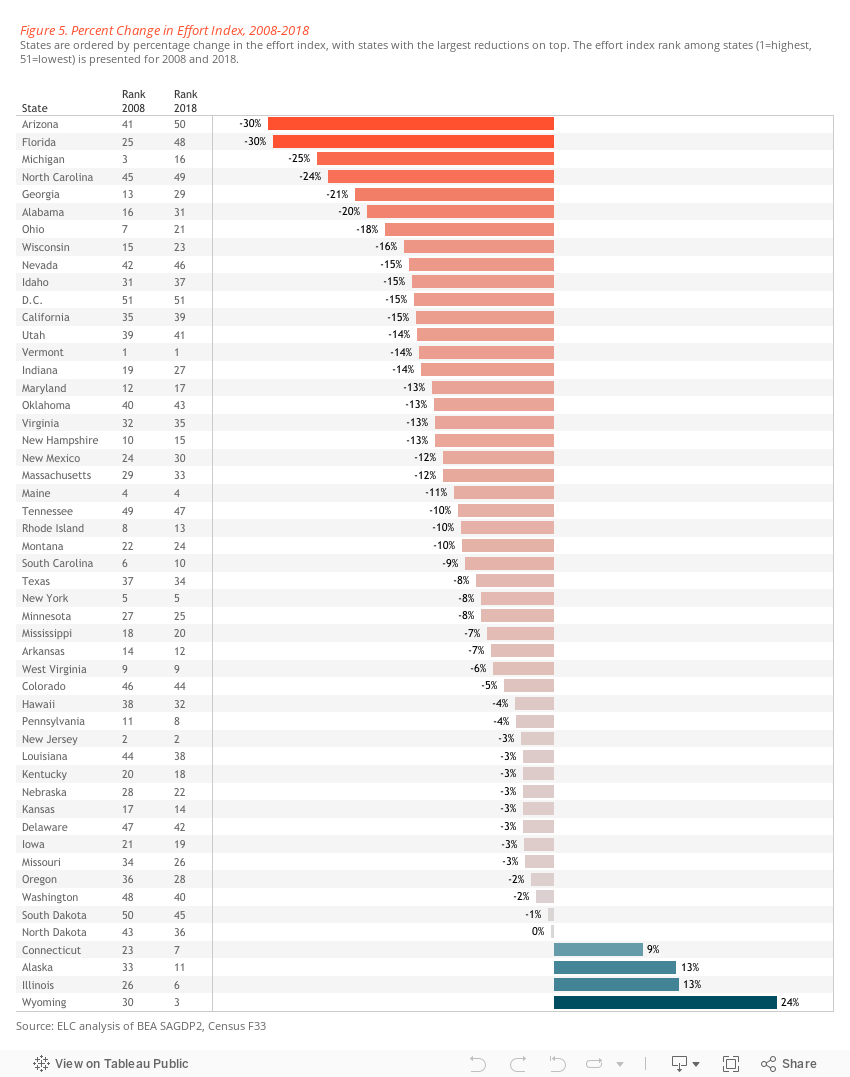
The effort index in 2018 was below 2008 levels in all but four states. Figure 4 presents the nominal change in each state’s effort index with states ordered by their effort rank in 2018; Figure 5 presents the change in percentage terms. Even though most states’ economies had recovered to pre-Recession levels, funding for PK-12 education remained a smaller portion of economic activity in most states. In some states, the disinvestment was dramatic. In 2018, the effort index in Arizona, Florida, and Michigan was more than 25% below 2008 levels. Nearly half of the states had an effort index that was at least 10% lower than in 2008. High and low effort states alike reduced their effort. Michigan and Ohio were ranked highly in effort in 2008 — 3rd and 7th, respectively — but significant reductions dropped these states to 16th and 21st by 2018. Some low effort states, including Arizona, North Carolina, and Nevada, were already ranked among the lowest effort states in 2008, therefore, despite substantial reductions in effort, their rankings did not drop significantly.
The Impact of Falling Effort on Funding Level
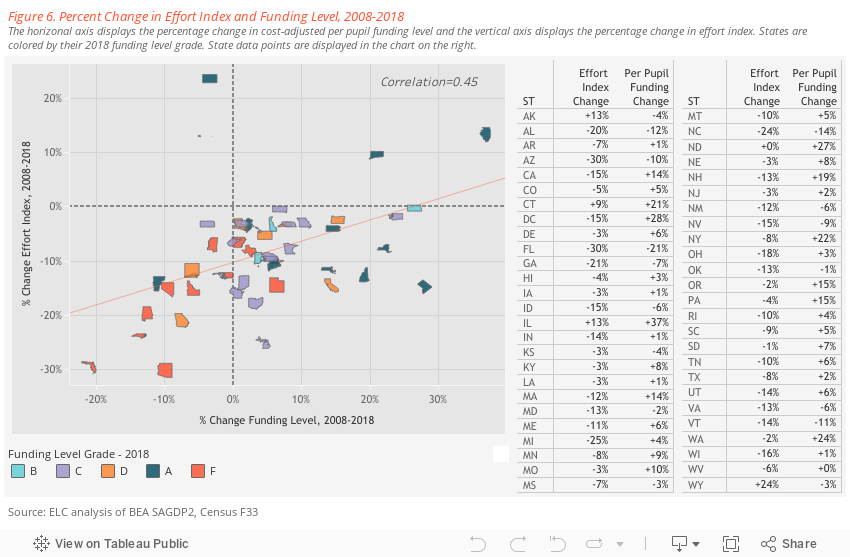
Our analysis finds a clear relationship between changes in state funding effort and changes in overall levels of public school funding (Fig. 6). When comparing the change in the effort index between 2008 and 2018 with changes in inflation-adjusted per pupil funding levels, we found that states with the greatest declines in effort also experienced the greatest reductions in school funding. For example, Florida reduced its effort by 30%, and per pupil funding declined by 21%. At the other end of the spectrum, Illinois increased its effort by 13% and increased per pupil funding by 37%. Not surprisingly, states with the lowest funding levels in 2018 (orange marks) are clustered in the lower left quadrant of Figure 6 with large reductions in effort and reduced per pupil funding levels.
$600 Billion Lost: The State-by-State Breakdown
Reductions in state fiscal effort mean public schools have less funding to provide teachers, support staff, and other education resources essential for student success. A reduction of 0.1 in the effort index translated to $34 million less in state and local revenues in Vermont, the nation’s smallest economy, and over $3 billion less in California, the nation’s largest. As our analysis shows, the effort index in most states dropped well below 0.1, in some states as much as ten times more (see Fig. 4).
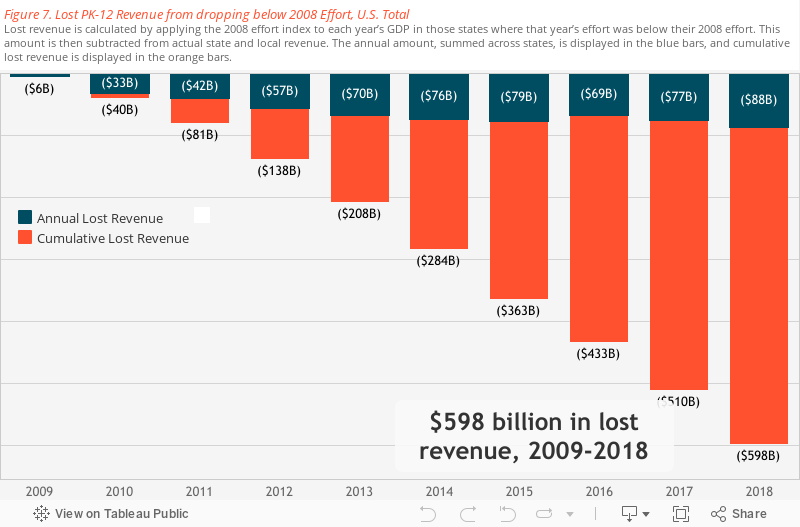
By failing to maintain a consistent level of effort to fund public education from 2008 through 2018, the nation’s public schools collectively lost $598 billion in state and local revenue. In 2018 alone, states would have raised more than $88 billion, a 13% increase in revenues, had they made the same effort as they did in 2008 (Fig. 7).
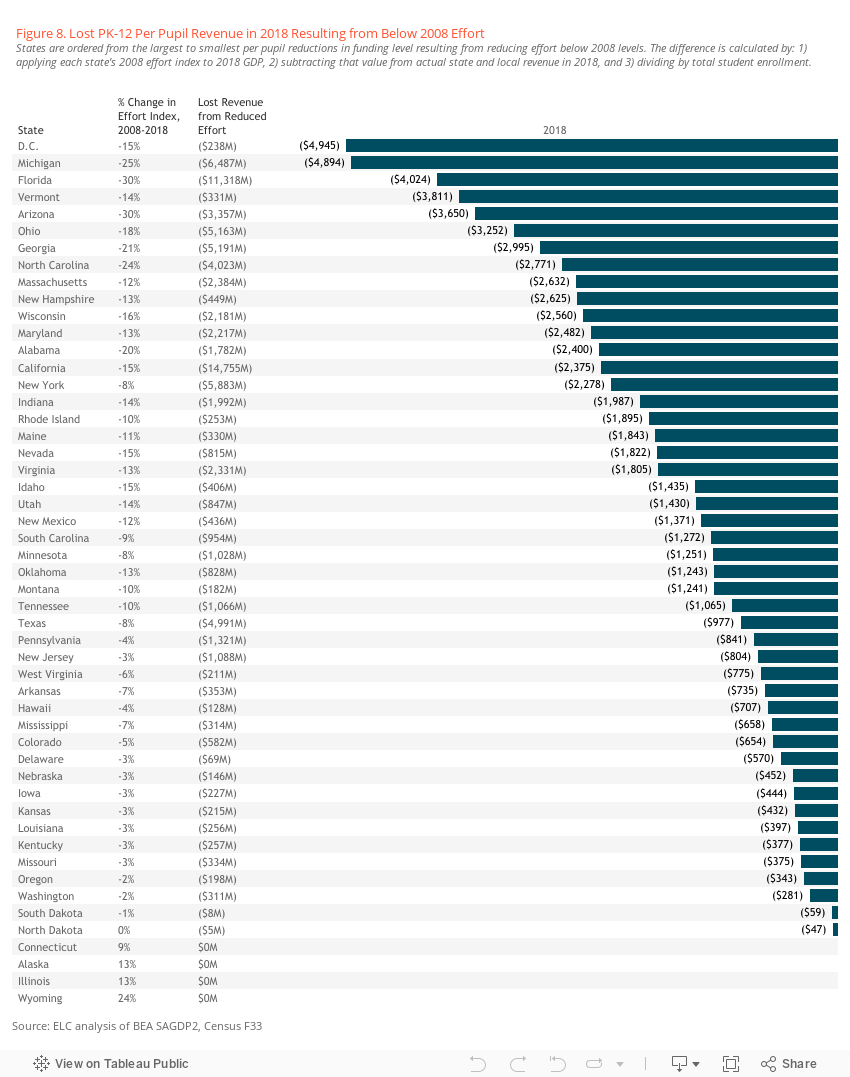
As expected, the impact of disinvestment in public education varies by state. On a per pupil basis, the greatest losses to public schools were in the District of Columbia and Michigan. Both would have raised nearly $5,000 more per pupil in 2018 if they had maintained their 2008 effort levels. Another fifteen states lost more than $2,000 per pupil (Fig. 8).
Avoiding the Cycle of Disinvestment
This report lays bare the depth and breadth of public education’s “lost decade” since the 2007 Great Recession. The ten-year price tag totals nearly $600 billion in public school disinvestment. As educators, parents and students across the country know all too well, the political decision made by state legislatures and governors to dramatically disinvest in their public schools has had significant and debilitating consequences on the quality of education available to public school children.
The nation’s public schools are now facing the next economic downturn. The coronavirus public health crisis presents a new set of daunting challenges for public schools, from ensuring remote learning for all students to safely reopening school buildings for in-person instruction and services. While the crisis will exact an economic toll, public schools in the coming months, if not years, will require more funding and resources, not less. And those resource needs will be even greater in schools serving communities segregated by poverty and race.
| View our tools for advocates for state-level profiles and a downloadable infographic |
The ability of states to withstand the impact of revenue losses from the pandemic hinge on enacting and sustaining progressive tax policies. This requires state elected officials to refrain from enacting regressive tax policies that time and again have proven ineffective in delivering the promised economic outputs. As documented by the Center on Budget and Policy Priorities, states that enacted deep income tax cuts after the Great Recession to boost economies and job growth did not get the promised results. Instead, these states were left in the precarious position of cutting appropriations for education, health care and other public services because these policies failed to produce revenue.[5] Kansas, for example, enacted some of the most regressive tax cuts, only to be forced to spend down reserves and make deep cuts to education and other services.[6]
To counteract these ineffective policies, progressive tax campaigns are building in states across the country. These campaigns typically propose raising income taxes on the wealthy, known as a “millionaire’s tax,” and dedicating those increased revenues for education and other social services. This November, Arizona voters approved Proposition 208, the Invest in Education Act, which raises income taxes on high earners and dedicates the estimated $940 million in new annual revenue to education for hiring teachers, raising salaries, and career and technical education programs. In 2012, after devastating Recession-era cuts to California’s school system, voters passed Proposition 30 dedicating billions of dollars to education through income taxes on the wealthy and a small increase in the sales tax. In 2018, California voters extended these tax provisions through 2030. These revenue increases were key to implementing school finance reform in the state through the Local Control Funding Formula. In 2019, Oregon’s legislature passed the Student Success Act, providing $1 billion in annual revenues for schools though an increase in corporate taxes.
The nation’s school children simply cannot afford another cycle of deep disinvestment in their education at the very time they need more resources, supports and interventions. As this report shows, the decision to disinvest in public education during the pandemic will be a political, not economic, one. While states are still holding out for federal support from an additional economic stimulus plan, federal funds will only provide short-term relief. It is incumbent on states to combat the immediate economic crisis with smart fiscal policies that prioritize long-term investments in their public schools.
View our tools for advocates for state-level profiles and a downloadable infographic
Endnotes
[1] David G. Sciarra, Danielle Farrie, Bruce Baker, Filling Budget Holes: Evaluating the Impact of ARRA Fiscal Stabilization Funds on State Funding Formulas, (January 2010), https://edlawcenter.org/assets/files/pdfs/publications/133_FILLINGBUDGETHOLES.pdf
[2] Elizabeth McNichol, Out of Balance: Cuts in Services Have Been States’ Primary Response to Budget Gaps, Harming the Nation’s Economy, (April 18, 2012), https://www.cbpp.org/research/out-of-balance.
[3] National Association of State Budget Officers, The Fiscal Survey of the States, (Fall 2018), https://higherlogicdownload.s3.amazonaws.com/NASBO/9d2d2db1-c943-4f1b-b750-0fca152d64c2/UploadedImages/Fiscal%20Survey/NASBO_Fall_2018_Fiscal_Survey_of_States_S.pdf
[4] The high effort level in 2009 is largely the result of the Recession causing a significant drop in GDP, though education funding had not yet been affected in most states.
[5] Michael Leachman and Michael Mazerov, State Personal Income Tax Cuts: Still a Poor Strategy for Economic Growth (May 2015), https://www.cbpp.org/research/state-budget-and-tax/state-personal-income-tax-cuts-still-a-poor-strategy-for-economic
[6] Michael Mazerov, Kansas Provides Compelling Evidence of Failure of “Supply-Side” Tax Cuts, (January 2018), https://www.cbpp.org/research/state-budget-and-tax/kansas-provides-compelling-evidence-of-failure-of-supply-side-tax-cuts