Making the Grade
2025
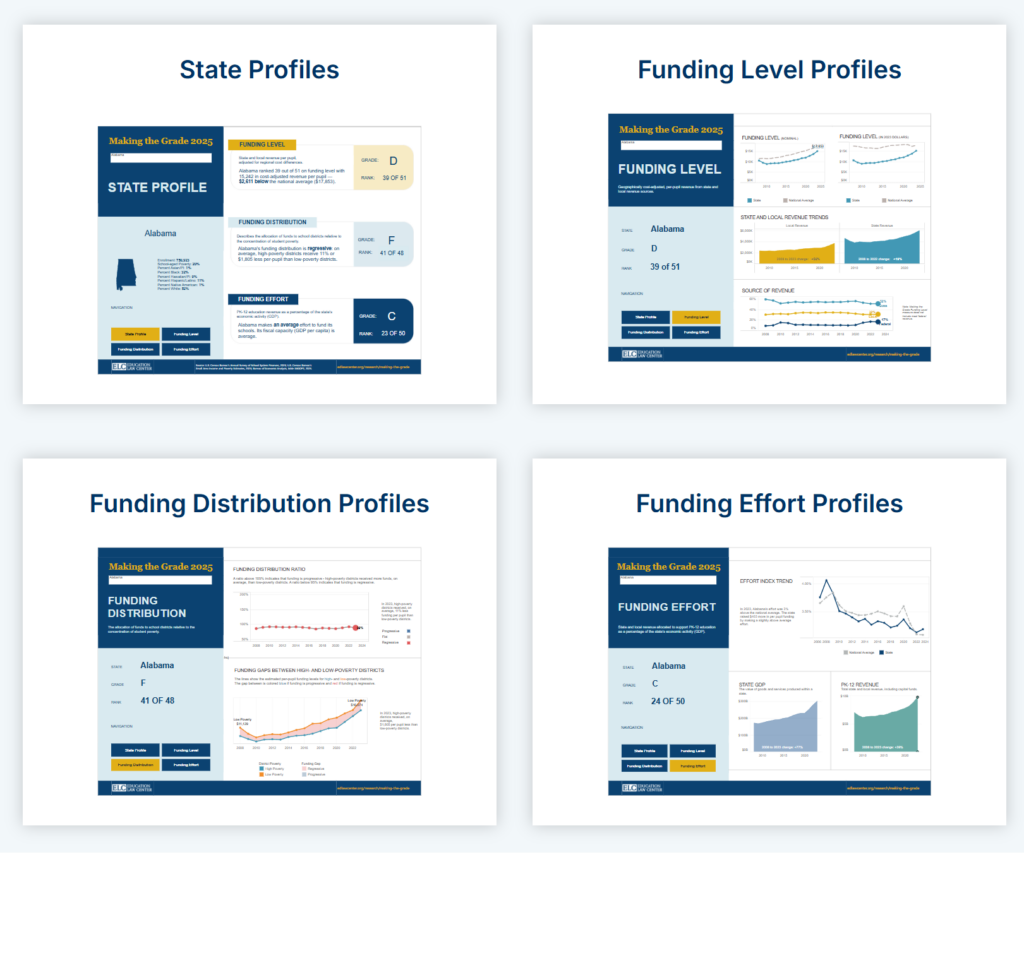
December 2025
New Jersey’s School Funding Reform act
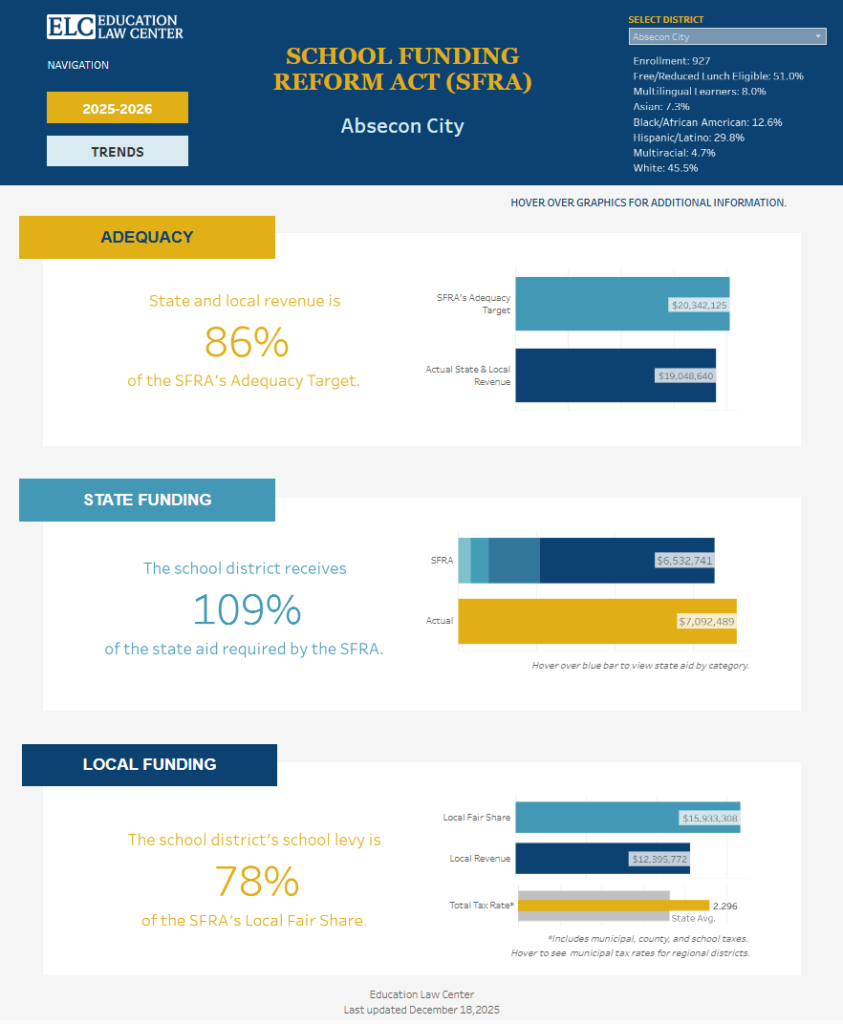
December 2025
Trump 2.0: Proposed FY2026 Budget Cuts to K-12 Education
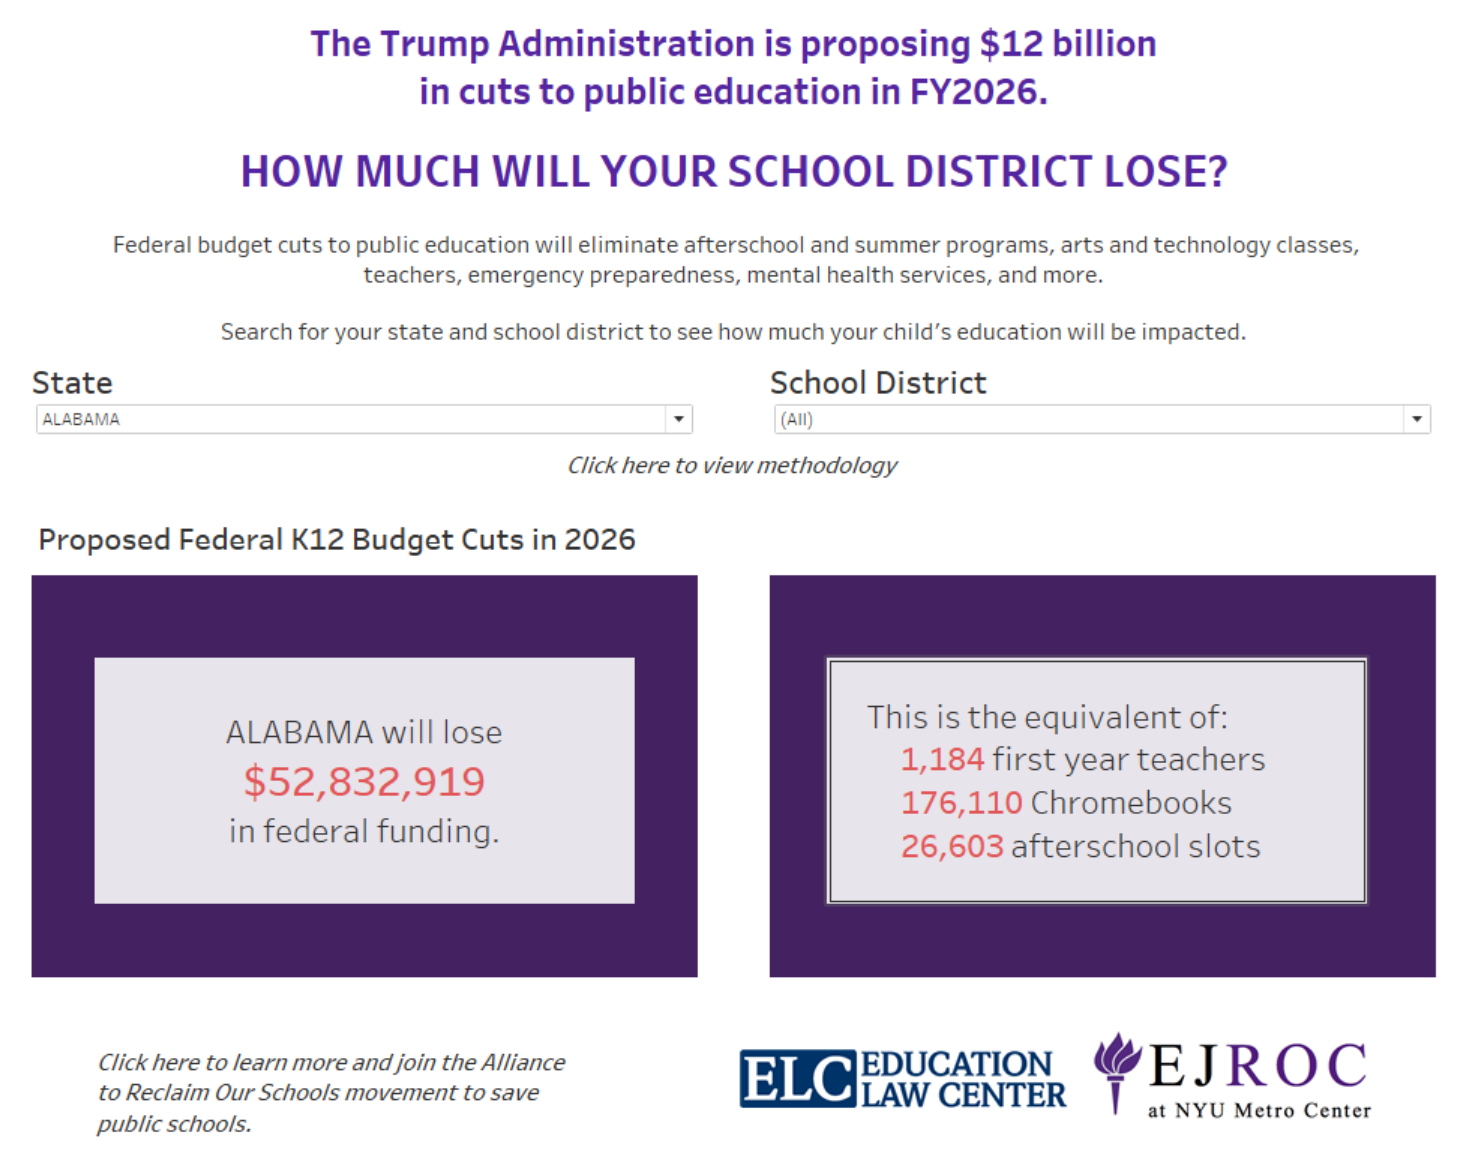
August 2025
Trump 2.0: How Much Federal Education Aid Does Your School or Congressional District Receive?
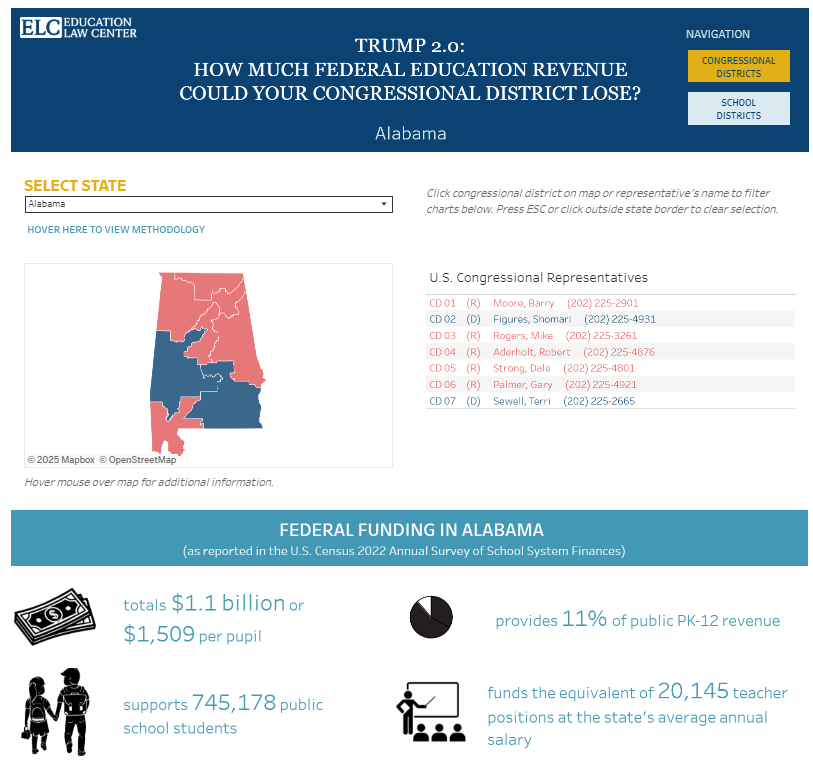
May 2025
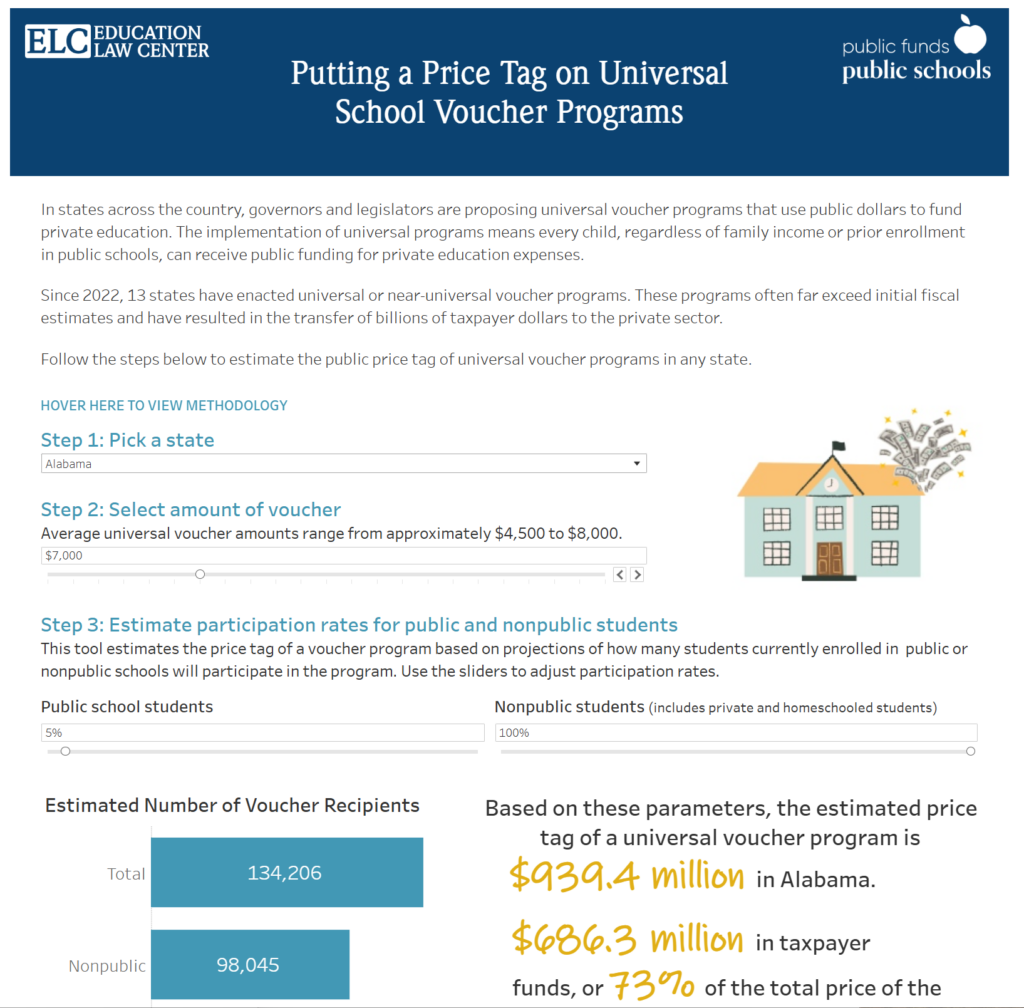
Universal Voucher
Price Tag Tool
March 2025
trump 2.0: how much federal aid could your state lose?
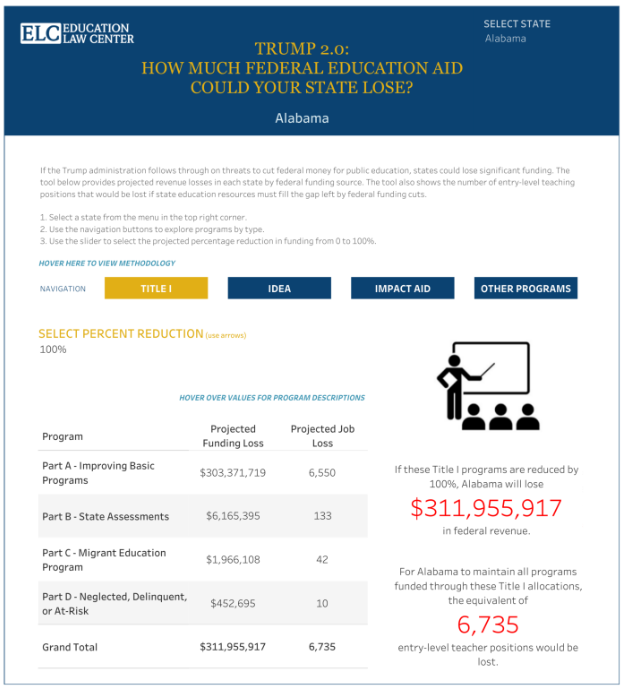
february 2025
New Jersey’s Abbott
Preschool Program
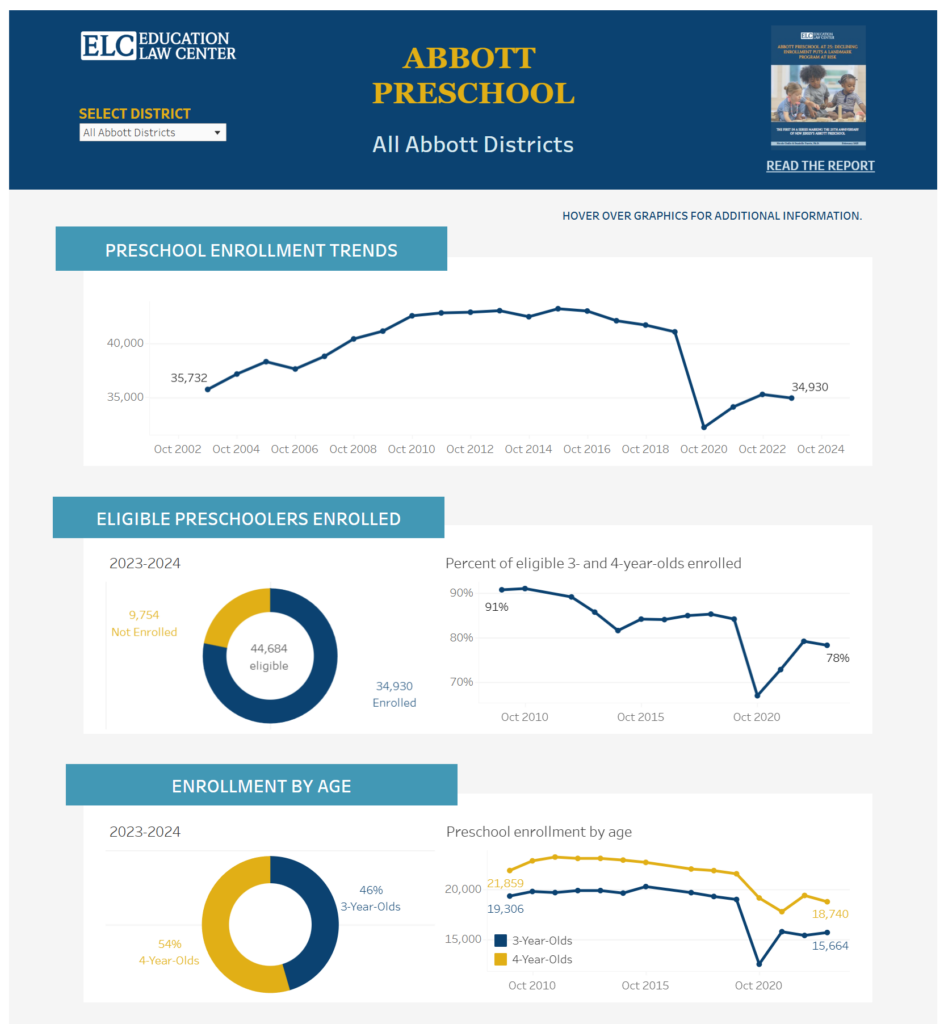
February 2025
Florida’s universal voucher program would cost billions
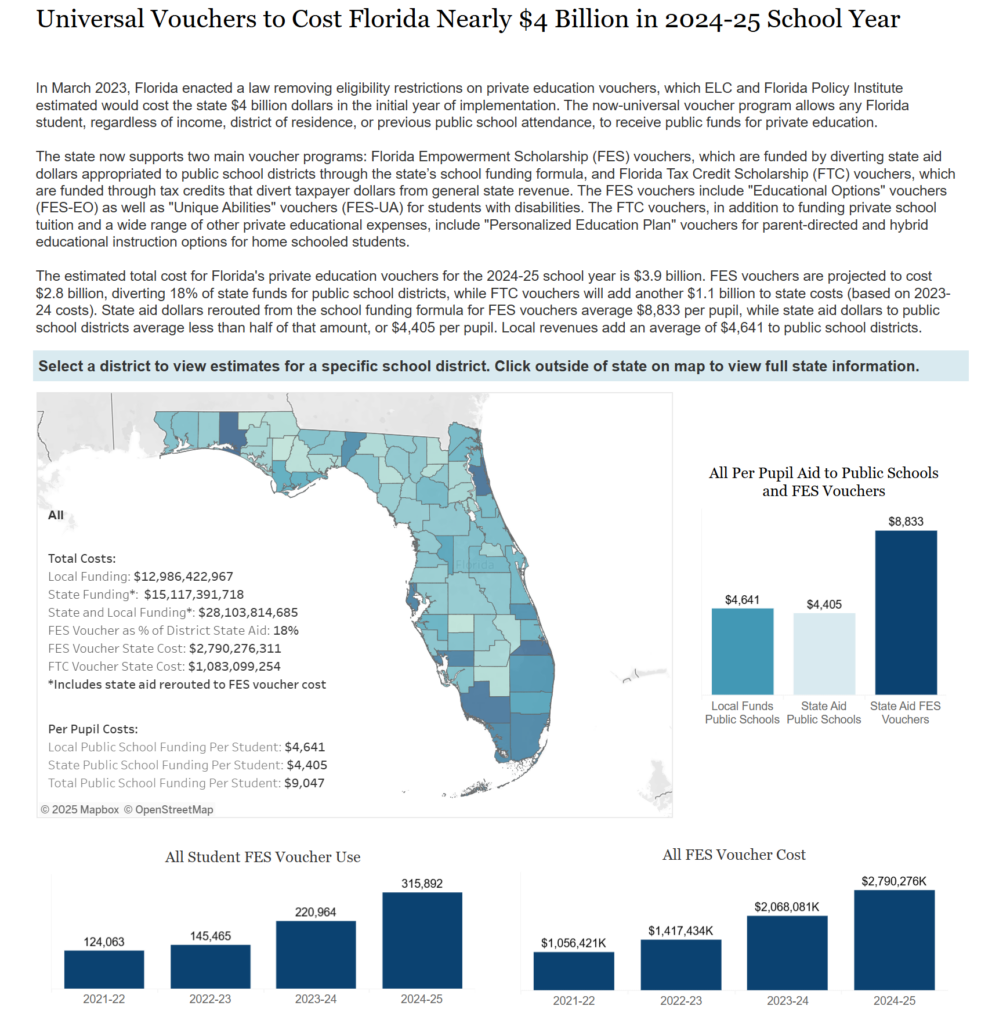
January 2025
For additional state-focused interactive tools, please visit ELC’s Resource Equity in the States page.