Replacing Georgia’s Early Intervention and Remedial Programs with Funding for Low-Income Students
Mary McKillip and Danielle Farrie
Abstract
Georgia’s school funding formula currently provides additional funds for academically struggling students through Early Intervention (EIP) and Remedial Education Programs (REP). These programs drastically underserve the number of students who are not proficient on state assessments, and participation is inconsistent across districts. Georgia could dramatically improve the allocation of resources to non-proficient students by replacing these programs with a poverty-based opportunity weight. A formula weight that increases the per pupil allocation for low-income students would more effectively deliver resources to academically struggling students, while also giving districts the flexibility to design academic and social interventions that address students‘ unique circumstances. We recommend that the Georgia Legislature 1) commission an independent cost study to determine the appropriate weight, 2) revise the funding formula to replace EIP and REP with the opportunity weight, and 3) develop an accountability framework to ensure that the funding generated is well spent.
Report PDF | Policy Brief | Press Release | Interactive Tools | QBE Primer
Introduction
All students should leave school with the academic preparation necessary for full participation in the local, state and national economy and in civic life. To achieve this goal, some students require extra supports to meet academic standards. Students from households and communities in poverty are more likely to need additional supports to succeed in school.
Specific funding targeted to low-income students is crucial to improve their educational opportunities and outcomes. Funds specifically designated for these students make it possible to more effectively address their educational needs through research-proven interventions, such as smaller class sizes, additional instructional supports, and high-quality teachers. This funding is even more important in districts serving high concentrations of students in poverty. This is as true in Georgia as it is nationally.
Georgia is one of only eight states that does not provide additional funding to students in poverty through the state’s school funding formula. Instead, Georgia’s formula provides additional funding for students who are identified as academically struggling based on their performance on state assessments. There are two such funding streams: the “Early Intervention Program” (EIP) for students in kindergarten through grade 5 and the “Remedial Education Program” (REP) for students in grades 6 –12. For more detail on how these programs are funded through Georgia’s school funding mechanism, the Quality Basic Education (QBE) formula, see QBE Primer: Georgia School Funding for At-Risk Students.
Under the current early intervention and remedial programs, districts lose funding when their programs are successful.
Georgia’s public education finance system provided $9 billion in state and local funds to school districts for direct instruction for the 2018-19 school year. Of that total, approximately $274 million was allocated for the EIP to serve 198,000 elementary school students. An additional $33 million was set aside for the REP to serve about 117,000 middle and high school students.
This report analyzes both the Early Intervention and Remedial Education Programs as currently designed and implemented and finds that they do not effectively target additional resources to Georgia’s at-risk student population. These programs fail to serve many students who are not meeting standards. In addition, the level of funds provided is insufficient to serve even those students who are the intended beneficiaries of the programs – students failing to achieve proficiency on state assessments. Funds are contingent on a student testing below grade level, meaning that students who show improvement are exited from the program, leaving them at risk of quickly falling behind again. Finally, the programs are capped and have rules that restrict school districts from providing a broader and more consistent set of support services to more effectively ensure achievement by all students at risk of falling behind.
The report recommends the program funding be refocused within Georgia’s QBE formula as an “opportunity weight” based on student poverty rather than performance on language arts and math assessments. An opportunity weight in the formula would allow the state to more effectively deliver additional resources to low-income students who are more likely to need additional academic supports. It would also give districts the flexibility to design academic and social interventions that address students’ unique needs. Districts that have had success using the Early Intervention and Remedial Education Programs could continue to provide students with those supports, while other districts would be able to select programs that better fit their students’ requirements.
By moving to an opportunity weight funding mechanism, nearly all districts, and especially those with high concentrations of students experiencing household and/or neighborhood poverty, would have access to additional funds for programs and services that would bolster existing interventions. While new revenue would be required to properly fund the opportunity weight across the state, reallocating funds from the existing programs would reduce that amount considerably.
Use our interactive tools to view district-level visualizations and simulate the impact of various opportunity weights at the district and state level.
The EIP and REP Underserve Struggling Students
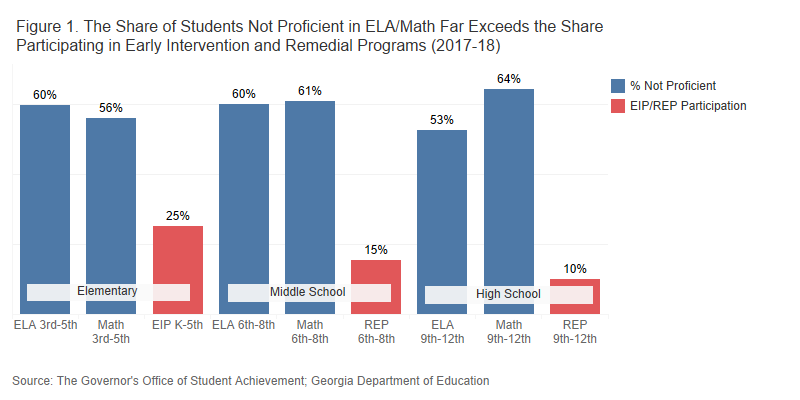
The Early Intervention and Remedial Education Programs, at current funding levels and as implemented, drastically underserve the students the programs are intended to serve: students scoring not proficient in English language arts (ELA) and math on state assessments (Figure 1). Data from 2017-18 show that while 60% and 56% of students were not proficient in 3rd– to 5th-grade ELA and math tests, respectively, only 25% of elementary school students participated in the EIP. Likewise, 60% and 61% of 6th to 8th graders were not proficient in ELA and math, respectively, and only 15% participated in the REP. In high school, 53% were not proficient in ELA, and 63% were not proficient in math, while program participation was only 10%.
In total numbers, of the approximately one million Georgia students failing to test proficient in math and a similar number of students not testing proficient in ELA, only 315,000 students are participating in the EIP and the REP. Even assuming a substantial level of overlap between the two groups (that is, many students not testing proficient in one subject are likely not to do so in the other), approximately 700,000 academically struggling Georgia students are not receiving intervention and remedial services through the programs.
Current eligibility for the EIP and the REP requires students to perform below state-established achievement benchmarks for their grade level in ELA and/or math, based on Georgia Milestone assessment scores or other performance measures. In higher grades, students may also be eligible through other processes, such as Student Support Team documentation or by failing an ELA or math course. Students eligible for the EIP may receive programming/instructional support for the entire school day or for only part of the day, depending on the approach used by the district. For the REP, students who are eligible can receive supplemental instruction for up to two classes (out of a total of six) during the school day.
Schools must follow Georgia Department of Education guidelines to receive funding for the Early Intervention and Remedial Education Programs. These guidelines can constrain how districts serve eligible students. When a student performs at grade level on the state ELA and/or math assessments, the district can no longer receive funding through these programs. In addition to the other limitations, funding for the REP is arbitrarily capped. In schools where less than 50% of students qualify for the federal free and reduced-price lunch program, a maximum of 25% of the student population may be funded for the REP. For schools with more than 50% of students eligible for free and reduced-price lunch, a maximum of 35% of the student population may receive funding from the program.
The EIP and REP are Weakly Related to Student Proficiency
The Early Intervention and Remedial Education Programs fail to provide adequate funding to serve the eligible universe of students who do not reach proficiency on state ELA and/or math assessments, and, consequently, most students testing below proficiency are not participating in the programs. Along with these glaring gaps in participation, the data show that districts with the largest proportions of non-proficient students do not have the highest participation rates in the programs.
Consider, for example, high school proficiency in 2017-18. In Figure 2 below, each symbol represents a Georgia school district. The chart shows the percentage of high school students in the district who were not proficient in math (horizontal axis) against the percentage not proficient on the English language arts assessment (vertical axis). The color of each symbol represents the percentage REP Participation in the district, ranging from red for districts with the lowest participation in programs (less than 10%), to the districts with the highest program participation in blue. The chart on the left shows the expected relationship between proficiency and REP participation: districts with the fewest non-proficient students (bottom left) have the fewest students in the state-funded REP (red districts). Districts with more non-proficient students (top right) have more students receiving the REP (blue districts). As the number of students not proficient in math and English increases, the proportion of students in the REP increases.
The drop-down menu above the chart can be adjusted to see that this disconnect between program participation and proficiency holds true for middle school REP and elementary school EIP.
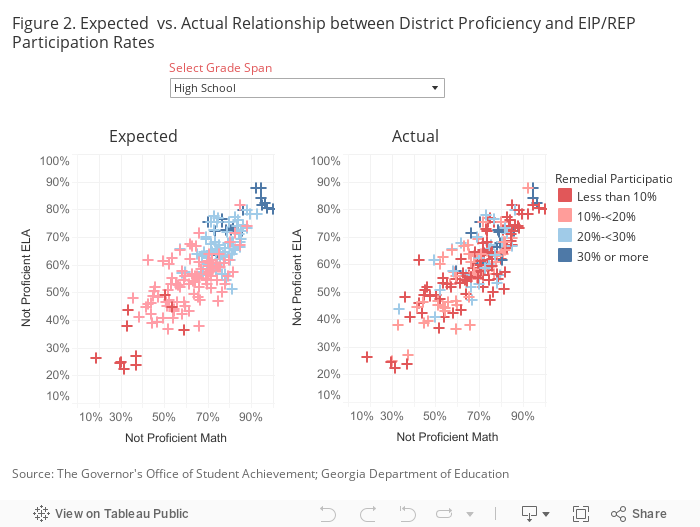
In the chart on the right, the actual proficiency and REP participation rates are displayed for Georgia school districts. The colors are much more mixed than would be expected. The percentage of students testing proficient in math or ELA is often not a good indicator of how many students participate in the Early Intervention and Remedial Education Programs. For example, districts with low participation (red districts) are scattered across the axes from high performing (bottom left) to extremely low performing (top right). It should be noted that districts may offer other services to struggling students through local funding or other funding sources. Yet, this data shows the state is not adequately funding the programs to serve eligible students.
The absence of a clear relationship between the EIP, the REP and the levels of student non-proficiency on state ELA and math assessments demonstrates that the programs are not reaching students in the districts most in need of additional programs and services for struggling students. There are many potential explanations for this disconnect. It may be that districts find the programs’ requirements too onerous, since program guidelines mandate that districts expend considerable resources to identify, serve, and evaluate students for participation. It may also be that the cost of implementation exceeds the program funding provided by the State. In fact, in 2017-18, 24 districts did not participate in the Remedial Program in high school and 16 districts did not participate in middle school. Two districts did not offer any Early Intervention Program for elementary students, despite having proficiency rates demonstrating a need for intervention and remediation.1 It is also unclear the extent to which the State is enforcing the caps on the number of students that districts may identify for the programs, thus potentially further reducing rates of participation.
Early Intervention and Remedial Program Funding is Undependable
In addition to evidence of inadequate levels of funding to serve all students eligible for participation in the EIP and the REP, the fundamental design of these programs is flawed. Funding for additional supports and services is conditioned on students remaining below proficiency levels. This design ignores the need for continued supports to keep at-risk students on track for sustained improvement on outcome measures. A student may qualify for the programs one year, then improve sufficiently to test out the next, and then – without additional academic support – fall below grade level and qualify for services the following year. Sustained, year-to-year funding for these students would help to ensure continuous academic growth over time. When funding fluctuates from year to year depending on the number of eligible students solely based on grade level test performance, it is not possible for teachers and administrators to adequately maintain program supports for struggling students. Furthermore, funding based on “student failure” provides no financial incentive to build successful programs that increase the number of students achieving grade level standards through program participation since, under the current framework, these programs lose money when they are successful.
Student Poverty is a Better Indicator of Student Academic Need
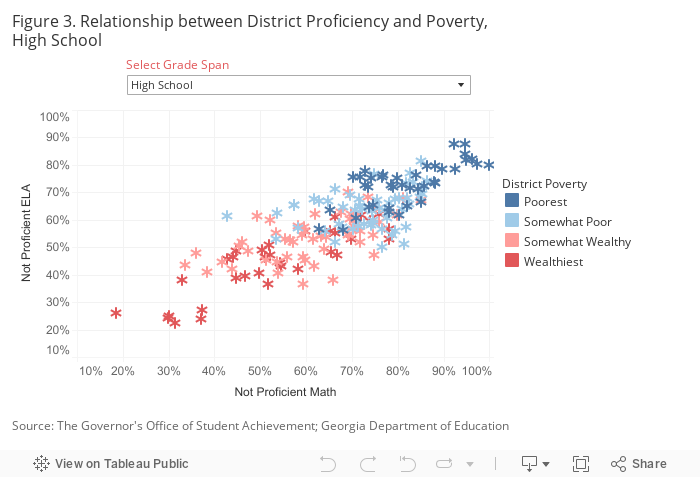
Instead of basing funding for remedial interventions on test results, student poverty2 is a stronger measure. The data show that Georgia school districts serving higher enrollments of students in poverty tend to have fewer students scoring proficient on state assessments. Figure 3 shows proficiency rates by four levels of district poverty from poorest to wealthiest. The wealthiest districts (red) have the lowest proportion of students not proficient in math and ELA in high school. As poverty increases in a district, the proportion of students not proficient on assessments also increases, with poorer districts (blue) concentrated at the highest levels of non-proficiency at the top right corner of the chart. This clear relationship where districts with higher poverty have more students who are not testing proficient on state assessments mirrors what we expected to see in the earlier chart of REP participation and proficiency but did not. This is counterintuitive but true: district poverty is a better predictor of student academic outcomes than participation in the EIP or the REP. Statistical analysis further demonstrates the strength of this relationship. The strong correlation between district poverty and academic outcomes indicates that the addition of an opportunity weight to replace EIP and REP funding would significantly improve the delivery of funding to districts with significant numbers of students not meeting proficiency standards.
Moving to Funding Based on Student Poverty
Despite the clear relationship between poverty and student outcomes, and the growing body of research linking adequate funding with improved outcomes, Georgia’s QBE formula provides no additional resources for high poverty school districts. While there is variation among districts, the average per-pupil funding for direct instruction allotments generated by the formula hardly differs between Georgia’s poorest and wealthiest districts. In 2018-19, there was only a $61 difference between the per-pupil allocations for instructional costs between those districts. This funding disparity is inconsistent with a well-established and widely accepted tenet of current methods of financing public education: poor students require additional programs and services to address the social and economic disadvantages that prevent them from reaching their full potential.
If an opportunity weight allocating funding based on student poverty is used in Georgia’s current funding formula, a higher per-pupil funding amount would be allocated for each economically disadvantaged student.3 Determining the appropriate weight would require the state to commission a cost study using accepted research methods to identify the specific staff, programs and services required to give disadvantaged students the additional support necessary to improve their academic achievement.
District poverty is a much better predictor of student academic outcomes than participation in early intervention or remedial education.
While a cost study is recommended, we calculate the cost of applying an opportunity weight of 0.2 and 0.5 in the current formula. These weights are consistent with other state’s weighted student funding formulas, though few of those states use weights based on state-specific research that determines the additional costs of educating students in poverty. Using these weights would provide 20% and 50% higher per-pupil funding levels, respectively, for students in poverty relative to the base cost in the QBE formula. At the current base cost of $2,621 per pupil, the 0.2 weight would increase funding for students in poverty by $524 per pupil, and a 0.5 weight would increase funding by $1,310 per pupil.
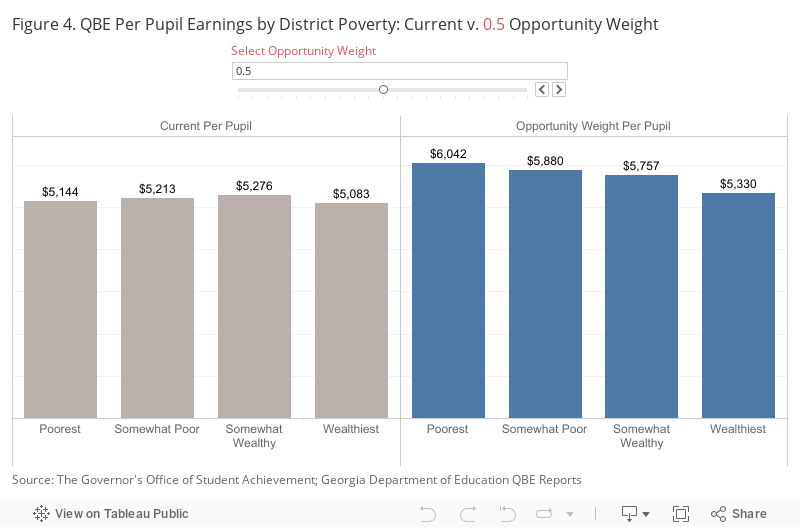
Replacing funding for the Early Intervention and Remedial Education Programs with an opportunity weight of 0.2 would generate an additional $137 million in QBE funding, an increase of less than 2% statewide. Estimating the impact by district poverty level, this weight would generate per-pupil revenues that are slightly higher or on par with current levels, with the largest funding increase allocated to the highest poverty districts. Forty districts would see funding reduced by a total of $40 million. A hold harmless provision could ensure that no district loses money and result in only a small fiscal impact. The higher opportunity weight of 0.5 would require a greater total investment of $798 million statewide, or a 9% increase in funding, but would offer a more significant benefit to the poorest districts. On average, per pupil revenue in the poorest districts would increase by $898 per pupil and by a more modest $247 per pupil in the wealthiest districts (see Figure 4). No districts would lose funding. Use the interactive tool in Figure 4 to model the impact of various opportunity weights by student poverty.
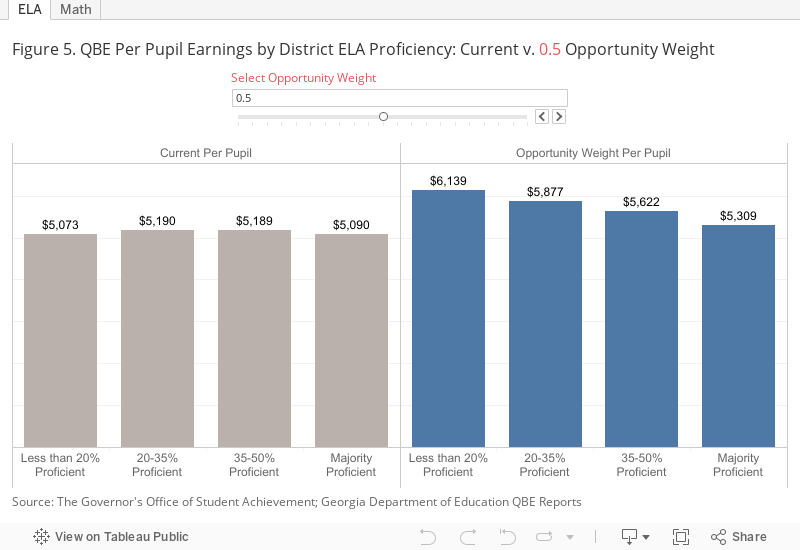
Districts with fewer students attaining proficiency in both ELA and math in grades 3-12 stand to benefit the most from an opportunity weight, with higher performing districts seeing a more modest increase in funding. For example, when applying the 0.5 opportunity weight, districts with ELA proficiency rates above 50% will see an average increase of $219 per pupil, while those with ELA proficiency rates below 20% will see an average increase of $1,066 per pupil. Use the interactive tool in Figure 5 to model the impact of various opportunity weights by student proficiency in ELA or Math.
Recommendations
The evidence and analysis in this report clearly support replacement of the current funding structure through the Early Intervention and Remedial Education Programs with funding based on an opportunity weight for students in poverty. A funding formula that allocates additional resources to districts based on the presence of economically disadvantaged students is a more effective mechanism to deliver resources to academically struggling students. We recommend the Legislature and Governor improve Georgia’s school funding system by taking the following steps:
- Immediately commission an independent cost study to determine the appropriate opportunity weight for Georgia. It is imperative that the opportunity weight be determined through an accepted costing out method, and not through budgetary considerations. There are four accepted methodologies for costing out spending levels for schools: professional judgement, successful district, cost function, and evidence based. One or more of these methods should be used to determine the additional cost of providing the supplemental programs and services that low-income students need to achieve the state’s academic standards. This analysis could also, for example, determine whether Georgia should utilize a single opportunity weight, or whether, as recently recommended in Maryland, the weight should vary based on a district’s poverty concentration, meaning that funding and resources increase as the concentration of economically disadvantaged students increases in districts.
- Revise the QBE formula by replacing the Early Intervention and Remedial Programs with the appropriate opportunity weight. The weight will be determined through the costing-out method. Depending on the overall cost of implementing the necessary weight, funding may be phased in over a defined period.
- Include an accountability framework in the new legislation to ensure that the funding generated is spent wisely and specifically addresses the needs of the target population. District should have flexibility in how opportunity weight funds are spent, but funds must be used to benefit disadvantaged students. For example, California’s recent school finance reform includes a requirement for districts to develop a Local Control Accountability Plan (LCAP) that engages the community in the development and review of district and school goals. These goals must focus on eight priority areas set by the state and based on raising achievement for all students. The Georgia Department of Education should provide districts with guidance and technical assistance on best practices to help inform planning at the district level and to ensure that the funding generated through the opportunity weight is effectively used. The state may also, for example, require that districts utilize a weighted funding formula for budgeting at the school level to ensure that funding is equitably distributed within districts.
Acknowledgments
This report benefitted from thoughtful reviews by Stephen Owens, Senior Policy Analyst at the Georgia Budget and Policy Institute; Justin Silverstein, Co-CEO of APA Consulting; and Robert Kim, education law/policy consultant.
This research was supported by the W.K. Kellogg Foundation.
Endnotes
1 For example, in 2017-18, the Muscogee schools did not serve any of the 30,686 district students through the state-funded EIP or remedial programming, even though 67% of students did not test proficient in ELA, and 71% of students were not proficient in math. In the Gwinnett schools, of the 178,065 students served, 21% were enrolled in the EIP, with 50% of elementary students in grades 3-5 not testing as proficient in ELA and 55% in math. No state-funded remedial programming is offered in Gwinnett, but 48% of students are not testing proficient in ELA in grades 6-12, and 51% are not testing proficient in math.
2 Poverty is measured through direct certification. Students are identified based on participation in other state assistance programs (SNAP, TANF, HeadStart, EvenStart) or based on student characteristics (homeless, migrant, foster or runaway). The levels were determined based on district poverty means and standard deviations as (1) poorest – poverty greater than 50%; (2) somewhat poor – poverty between 40 and 50%; (3) somewhat wealthy – poverty between 25 and 40%; and (4) wealthiest – poverty less than 25%.
3 State funding formulas have typically used free/reduced lunch (FRL) eligibility to identify students for poverty weights. This is becoming increasingly difficult as more schools and districts utilize the Community Eligibility Provision to provide free lunch to all students, regardless of individual eligibility. Many states are now turning to direct certification (participation in programs such as SNAP and TANF) as a replacement. Because the income thresholds for direct certification programs are lower than in FRL, an adjustment factor is necessary to expand the pool of students eligible for the weight. The federal Healthy, Hunger-Free Kids Act of 2010 recommended multiplying direct certification enrollments by a factor of 1.6 to approximate FRL. For more on alternative measures of student poverty see Greenberg, E. (November 2018) New Measures of Student Poverty: Replacing Free and Reduced-Price Lunch Status Based on Household Forms with Direct Certification.