
Introduction
Education Law Center’s Making the Grade is an annual overview of the condition of school finance in the states. The current report presents a picture of school funding in the 2022-2023 school year, the most recent data available. The report provides a comparative analysis of the degree to which states are fairly funding schools so that all students have the chance for success.
For students to have a meaningful opportunity to achieve a state’s academic standards, three core principles must be followed: 1) students need a sufficient level of funding so that schools have adequate staff, programs and services; 2) low-income school districts need even greater funding to address the additional costs associated with student poverty; and 3) state lawmakers need to raise sufficient revenue, either through state or local sources, to ensure that all schools have adequate funding.
Making the Grade evaluates states on three measures of funding fairness aligned with those principles: funding level, funding distribution, and funding effort. The funding level measure analyzes between-state funding equity by ranking states on their average cost-adjusted per-pupil funding levels. The funding distribution measure analyzes within-state equity by examining how state and local funds are distributed relative to student poverty. We characterize states as progressive—with higher funding levels in high-poverty districts, regressive—with lower funding levels in high-poverty districts, or flat—where there is no clear pattern in funding relative to poverty. The funding effort measure analyzes how much states prioritize education funding by ranking state and local revenue as a proportion of each state’s economic activity, or GDP.
Key Takeaways
The main findings of Making the Grade 2025 are:
- Average per-pupil funding levels continue to vary greatly among states. There is a funding gap of more than $17,000 between the highest (New York) and lowest (Idaho) funded states, even after accounting for regional cost differences.
- Seventeen states had at least a modestly progressive distribution of state and local funding relative to student poverty. With eleven fewer progressive states than in 2022, this represents the first reversal of progress after a five-year trend towards increasing progressivity among states.
- States are making markedly different efforts to fund their public schools, where effort is defined as state and local revenue as a percentage of the state’s GDP. The highest effort state (Vermont) makes more than double the effort to fund schools as the lowest effort state (North Carolina). While most states saw positive year-over-year growth in both education revenue and GDP, economic growth outpaced investments in public education, resulting in declining effort in most states.
- Though federal dollars are a small proportion of overall education revenue, those dollars do contribute to a more equitable distribution of funds relative to poverty in nearly every state.
Federal Upheaval Threatens Public Schools
This edition of Making the Grade is published in a time of unprecedented uncertainty. Public schools are bracing for an FY26 federal budget that could dramatically alter the financial support that states receive from the federal government. Threats against states and individual school districts whose policies are at odds with the administration’s priorities are already being realized. For example, over $30 million in special education grants were terminated in September of this year, affecting 14 states. In each case the notices cited district language that referenced diversity, equity, inclusion, and racism.1 The administration canceled dozens of contracts within the U.S. Department of Education’s research branch, the Institute of Education Sciences (IES), halting projects in various stages of completion, many of which should be protected by congressional mandates.2
And even as Trump’s executive order to dismantle the Department of Education is challenged in court,3 mass layoffs have undermined the ability of the Department to execute its core mission—to promote student achievement and ensure equal access to educational opportunity.4 The Office of Elementary and Secondary Education, the Office of Civil Rights, the Office of English Language Acquisition, and the Office of Special Education Programs have all been affected by layoffs that impede their ability to perform basic functions and leave the country’s most vulnerable students at risk.5
Data and Research Compromised
In addition to terminating research contracts within IES, reductions in force have also drastically reduced the number of employees who manage the day-to-day work required of the organization. IES is operating with a skeletal staff of fewer than 20 federal employees, down from 175.6 The largest division within IES, the National Center for Education Statistics (NCES), has been hollowed out with only three remaining employees.7 NCES is the federal statistical agency responsible
for collecting, analyzing, and reporting data on the condition of U.S. education. The data collected by this agency are used by researchers, policymakers, and advocates. These cuts threaten their ability to generate timely analyses of all aspects of education across the U.S., from demographics to student performance.
Next year, will we have access to the data that is used to generate reports like this one? Reliable state-level school funding comparisons will be nearly impossible without the federal effort to collect and report compatible revenue data across all school districts and states. The Survey of School System Finances (F33), the primary data used in this report, is collected by the U.S. Census Bureau in collaboration with NCES. The Census Bureau has thus far escaped mass firings but still lost 1,500 workers, including many high-level employees, through a resignation incentive program.8 Current and former workers worry about the agency’s ability to continue to produce reliable statistics.9 Even if data collection continues, the quality of the data produced will be questionable since NCES no longer has sufficient staff to perform the necessary quality control or even the ability to respond to requests for technical assistance from state and school district employees responsible for responding to surveys.
Timely and reliable data is vital for those who are committed to improving the quality of education across the country, concerned about disparities in access to educational opportunity, and intent on using information and research to inform decisions and policymaking that will benefit students, families, and educators.
Where do we go from here?
Making the Grade is based on the premise that the core responsibility for creating fair school funding systems lies with states. State funding formulas and other state and local funding mechanisms are responsible for the overwhelming majority of education funding. Historically, federal revenue, as we show in this report, has had a minimal impact on reducing fiscal disparities among states. Though federal funding helps make within-state distribution modestly more progressive and provides funding to support critical programs for students who most need it, at current levels it cannot “fix” a state that refuses to fairly and adequately fund its public schools.
Therefore, it is incumbent on advocates to fight for fair school funding on all fronts. That requires advocating for meaningful investments in public education at the federal, state, and local level. At the federal level that means protecting grant programs that support students in need, improving those programs so that students reap the largest benefits possible, and continuing to operate an education department that fulfills its mission of expanding opportunity and improving student achievement. At the state and local levels, this means continuing to press for school finance reforms so that, no matter what happens in Washington, D.C., families and educators are supported by fair and equitable school funding policies that recognize the true cost of education and ensure that all students, from preschool through adulthood, are given the opportunity to thrive.
How Fair is school funding in your state?
What Is Fair School Funding?
We define fair school funding as the funding needed in each state to provide qualified teachers, support staff, programs, services, and other resources essential for all students to have a meaningful opportunity to achieve a state’s academic standards and graduate from high school prepared for citizenship, postsecondary education, and the workforce. A fair funding system is the basic foundational building block for high-performing, effective, PK-12 public school systems. Fair funding has two basic components: a sufficient level of funding for all students and increased funding for high-poverty districts to address the additional cost of educating students in those districts. These two components are dependent on a third factor: the effort made by state lawmakers to raise sufficient revenue to support their public schools so they can meet state-established curriculum content and performance objectives.
Why the States?
Unlike other countries, the United States has no national education system. Instead, states, under their respective constitutions, have the obligation to support and maintain a system of free public schools for all resident children. The states, and not local school districts or the U.S. Congress, are the unit of government legally responsible for operating the nation’s public schools and providing the funding necessary to support and maintain those schools. All states fund their schools through a statewide method or formula enacted by the state legislature. These school funding formulas, or school finance systems, determine the amount of revenue school districts are permitted to raise from local property and other taxes and the amount of funding or aid the state is expected to contribute from state taxes. In annual or biennial state budgets, legislatures also determine the actual amount of funding districts will receive to operate their schools – amounts which do not always align with the state’s funding formula. All states fund their schools through a statewide method or formula enacted by the state legislature. These school funding formulas, or school finance systems, determine the amount of revenue school districts are permitted to raise from local property and other taxes and the amount of funding or aid the state is expected to contribute from state taxes. In annual or biannual state budgets, legislatures also determine the actual amount of funding districts will receive to operate their schools – amounts which do not always align with the state’s funding formula.
Why Does Fair School Funding Matter?
A fair, equitable, and adequate school funding formula is the basic building block of a well-resourced and academically successful school system for all students. A strong funding foundation is even more critical for low-income students, students of color, English learners, students with disabilities, and students facing homelessness, trauma, and other challenges. These students, and he schools that serve them, need additional staff, programs, and supports to put them on the same footing as their peers. Research on the needs of vulnerable student populations for extra academic and academically related programs and services is compelling, as is growing evidence that increased investments in these students improves academic achievement and other outcomes.10

Making the Grade analyzes the condition of public school funding in all 50 states and the District of Columbia. Using the most recently available data from the 2022-2023 school year, the report ranks and grades each state on three measures to answer the key question: How fair is school funding in your state?
The three fairness measure are:
- Funding Level – cost-adjusted, per-pupil revenue from state and local sources (Figure 1a);
- Funding Distribution – the extent to which additional funds are distributed to school districts with high levels of student poverty (Figure 2a);11
- Funding Effort – funding allocated to support PK-12 public education as a percentage of the state’s economic activity (GDP) (Figure 3a).
The state rankings and grades on these measures provide crucial data to inform advocates, policymakers, business and community leaders, teachers, parents, and students about the equity and adequacy of public school funding in their state. Making the Grade is designed to assist residents working to improve the level and distribution of funding for public school students.

This report utilizes national data sets to analyze the condition of school funding in the states.
Data Sources The U.S. Census Bureau’s Annual Survey of School System Finances, the U.S. Census Bureau’s Small Area Income and Poverty Estimates, and the U.S. Bureau of Economic Analysis’ State Gross Domestic Product reports. The report focuses on data from the 2022-23 school year.
Funding Level is determined by dividing state and local revenue for PK-12 education by student enrollment. Because our focus is on state finance systems, federal revenue is not included, except for Indian, Native Hawaiian, and Alaska Native Education Aid (Title VI) and Impact Aid (Title VII), as they are intended to replace, not supplement, state and local funds.12 We also exclude revenue for capital outlay and debt service programs. These revenues tend to be uneven from year to year, and one-time or short-term investments may obscure more prevalent funding patterns. Finally, district-level payments to charter schools, private schools, and other school systems that are reported as expenditures are subtracted from the revenue total. These revenues are attributable to students typically not included in the enrollment count. The resulting per-pupil funding levels are adjusted for regional differences using the National Center for Education Statistics’ Comparable Wage Index for Teachers.13
Funding Distribution utilizes a modified version of the regression-based method developed by Bruce Baker, professor in the School of Education and Human Development at the University of Miami, and published in Is School Funding Fair? A National Report Card (editions 1-7), to model the pattern of funding relative to district poverty within each state.14 The analysis essentially asks: Once differences in costs related to district size and geography are accounted for, do states provide more or less funding to districts as the poverty rate increases? Using district-level revenue data (as defined above for funding level), the model predicts funding in a high-poverty (30% Census poverty) relative to a low-poverty (5% Census poverty) district. States that provide higher per-pupil funding levels to high-poverty districts are progressive; states that provide less to high-poverty districts are regressive; and states where there is no meaningful difference are flat.
Funding Effort is measured as total state and local revenue for PK-12 education (including capital outlay and debt service, excluding all federal funds) divided by the state’s gross domestic product (GDP). GDP is the value of all goods and services produced by each state’s economy and is used here to represent the state’s economic capacity to raise funds for schools.
Grades are assigned using the normal curve. This means that grades indicate how each state performed relative to other states, not relative to any particular benchmark. A standardized score is calculated as the state’s difference from the mean or average, expressed in standard deviations. Grades are as follows: A = 2/3 standard deviation above the mean; B = between 1/3 and 2/3 standard deviations above the mean; C = between 1/3 standard deviation below and 1/3 standard deviation above the mean; D = between 1/3 and 2/3 standard deviations below the mean; F = 2/3 standard deviation below the mean.
For more details on report methodology, see the Technical Appendix.
The Fairness Measures
Funding Level
Funding level is determined by dividing combined state and local revenue for PK-12 education by student enrollment and adjusting to account for regional variation in labor market costs.
A state’s funding level grade is determined by ranking its position relative to other states; the grade does not measure whether a state meets any particular threshold of funding adequacy based on the actual cost of education resources necessary to achieve state or national academic standards.15
Our analysis highlights the significant disparities in per-pupil funding across states, with many states spending thousands of dollars per pupil more than the national average, and other states spending thousands of dollars per pupil less (Figure 1a). The highest-funded state, New York, spends two and half times as much as the lowest-funded state, Idaho. Even after adjusting for regional cost differences, the highest funded states are largely in the Northeast while the lowest funded states mostly span the South and Southwest (Figure 1b).


Funding Level Trends
Most states maintained or at least slightly increased their per-pupil funding levels from 2022, even after adjusting for inflation (Figure 1c). This is a dramatic departure from 2022, when high inflation rates wiped out most of the nominal per-pupil funding increases in most states.16 Only nine states had per-pupil funding losses, though large funding reductions were seen in Louisiana (-8%), Wyoming (-6%), Nevada (-4%), and New York (-4%). Some states saw significant per-pupil funding increases, notably California (19%), Washington D.C. (15%), Hawaii(15%), and Michigan (13%).

For some states, per-pupil funding changes were so dramatic that they significantly changed their ranking relative to other states (Figure 1d). For example, Alaska’s funding declines led to a drop from a rank of 20th in 2022, down to 28th in 2023, while maintaining a C grade. Louisiana fell from 25th to 38th, dropping from a C grade to a D. On the other hand, California and Hawaii both moved up more than 10 spots and attained higher grades: California from a C to a B and Hawaii from a D to a C. It is worth noting that there is very little movement among the lowest funded states, a pattern that is repeated annually.


Funding Distribution
A critical element of school funding fairness is whether funding is allocated within states to address the additional costs associated with student poverty. The funding distribution measure describes the relationship between district-level, per-pupil funding and student poverty in each state.

Figure 2a depicts funding distribution in each
state by comparing the average per-pupil funding allocated to high-poverty districts to that allocated to low-poverty districts (the funding distribution ratio). States are defined as “progressive” if high-poverty districts receive at least 5% more funding than low-poverty districts. States that do the opposite, where high-poverty districts receive at least 5% less funding than low-poverty districts, are “regressive.”17 States with similar funding levels in high- and low-poverty districts, even if there is wide variation in funding among districts that is unrelated to student poverty, have a “flat” distribution.
While we do not propose a specific target for how much progressivity is enough, we maintain that
flat or regressive distribution patterns are unlikely to adequately support low-income students and certainly put high-poverty districts at a disadvantage. However, it is important to remember that our grades are assigned on a relative basis, meaning that states are compared to each other, and their rankings do not necessarily align with these categorizations. The average distribution ratio in 2023 was 105%, and states receiving a grade of C range from flat (101%) to progressive (111%).
In 2023, 17 states met our definition of progressive. Nineteen states had a flat distribution, and 12 states were regressive. States exhibit a wide range, with the most progressive state, Utah, providing, on average, 60% more funding per pupil to high-poverty districts, and the most regressive state, Connecticut, providing, on average, 19% less funding to high-poverty districts.

Funding Distribution trends
In last year’s installment of Making the Grade, we documented the decade-long trend of increasing progressivity in states. Unfortunately, that trend reversed in 2023. The number of progressive states dropped from 28 to 17 in just one year, with most of those formerly progressive states slipping towards a flat distribution (Figure 2b).

Figure 2c shows how each state’s funding distribution ratio changed between 2022 and 2023. States with the largest gains were California and Alaska (+11). States with the largest losses were Tennessee (-19), Idaho (-17), New York (-13), and North Dakota (-13). The declining number of progressive states is largely the result of previously modestly progressive states slipping to a flat distribution.
It can be difficult to assess the causes of year-to-year fluctuations in the funding distribution ratio. Changes may result from deliberate school funding policy reforms, as in California, where implementation of the Local Control Funding Formula resulted in funding increases that were targeted to the state’s most disadvantaged school districts. Trend data for California clearly reflect steady improvements as this policy change was phased in over a number of years.18
In other cases, changes affecting individual school districts with large student populations may alter statewide patterns absent any significant state policy reform. For example, New York has over 600 school districts, but one-third of students are educated in the New York City’s single district (Figure 2d). Fluctuations in revenue in that one district can drive changes in the distribution pattern across the state. Between 2021 and 2022, reported local revenue in New York City increased by 13%, driving up per-pupil revenue and increasing the state’s funding ratio from 107% to 118%. When that reported local revenue declined by 21% between 2022 and 2023, the state’s funding ratio dropped back down to 105%. These vast swings were not related to any policy change at the state level and reflected a seemingly temporary influx of local revenue.


Fairness Profiles
The fairness of a state’s school funding system is contingent on both adequate funding levels and a progressive distribution of funds. Some seemingly well-resourced states, such as Connecticut and Maine, do a poor job of targeting funds where they are most needed, leaving large disparities in the average funding levels of the highest and lowest poverty districts. Likewise, some states with a progressive distribution, such as Georgia and South Dakota, have low overall funding levels that leave even their highest poverty districts with funding that does not reach the national average (Figure 2e).

Funding Effort
Figure 3a ranks states on effort measured as PK-12 revenue as a percentage of the state’s economic activity, or gross domestic product (GDP).19 It is important to note that the effort calculation includes both state and local funding for schools and serves as an indicator of the overall capacity of the state to generate revenue through taxes, whether at the local or state level.

While we rank the states using the effort index, these rankings require additional context. A state’s effort must be evaluated in relation to its economic wealth. Consider New Hampshire and Mississippi: Both states receive a C for average effort, but one state is relatively wealthy with a high per-capita GDP (New Hampshire: $66,657), while the other has a relatively low per-capita GDP (Mississippi: $40,619). Though these states are making a similar effort to fund schools, New Hampshire can generate much higher per-pupil funding levels than Mississippi ($22,137 and $13,559, respectively). In other words, the same effort does not generate the same results for each state, and some states may require higher effort than others to reach adequate funding levels. Figure 3a shows a state’s effort compared to the national average with its per-capita GDP and per-pupil funding levels to contextualize how the effort index interacts with the state’s relative wealth to produce high or low funding levels.
In 2023, state effort ranged from a high of 5.4% in Vermont, to a low of 2.0% in North Carolina.
Most high-effort states were able to generate above-average funding levels, even when they had below-average fiscal capacity (GDP per capita), e.g., Vermont, Michigan, and Maine. Some low-effort states, such as Delaware and North Dakota, were able to generate above-average funding levels because of their high fiscal capacity. But too often, states with low fiscal capacity, such as Florida and Arizona, are at a double disadvantage because they are also making a below-average effort to fund schools, leading to low funding levels.

Funding Effort Trends
The average funding effort remains at the depressed levels seen over the past few years and did not change much from 2022 (Figure 3b). Funding effort declined in about half of the states and increased in the other half (Figure 3c). In most states where effort declined, inflation-adjusted investments in education increased, but those increases did not keep pace with growing economic activity. There are, however, a few notable exceptions. Nevada, Wyoming, and New York experienced the largest declines in the effort index, and those declines were driven by reductions in educational investments, i.e., total state and local revenue for public schools.
Several states saw significant increases in the effort index due to substantial investments in public school funding, as documented in the funding level analysis. California and Hawaii both dramatically improved their position on the effort index ranking, with California climbing from 34th to 20th and Hawaii moving from 28th to 12th. These two states also had the largest increase in inflation-adjusted total state and local education revenue, 17% in California and 22% in Hawaii.


What Role Does Federal Revenue Play?
Making the Grade focuses exclusively on state and local revenue. The reason for excluding federal funds—except those that are intended to replace local revenue, such as Impact Aid—is that, even in states with a relatively high federal share, the majority of school revenue comes from state or local sources through formulas determined by state legislatures.20 In states with unfair school funding systems, the lever for change is state policy.
However, we now find ourselves in an unprecedented situation. Federal funding for public education is being threatened on an astonishing scale. President Trump’s FY26 budget request reduces the Education Department’s budget by $12 billion (15.3%).21 That includes a $4.5 billion (70%) reduction across 18 competitive and formula grant programs, including literacy and afterschool programs, teacher improvement grants, and more. The president’s request also proposes to eliminate funding for English Language Acquisition ($890 million), Adult Education ($729 million) and Migrant Education ($428 million) programs.
Consistent with the vision expressed in the Heritage Foundation’s Project 2025 blueprint,
the administration has also touted the notion of “returning” education decision-making to states and local communities.22 For example, the proposed Trump budget converts formula-based grants into block grants, potentially allowing states to divert federal funding away from its intended recipients. Therefore, while the federal government provides a small percentage of the overall funding for public education across the country, these proposed changes to federal programs could have a significant impact on school districts across the country.
To illustrate the contribution that federal funds make to fiscal equity when measured both between states and within states, below we present Making the Grade’s funding level and funding distribution measures including federal revenue. Because federal money for education in 2020 through 2023 included non-recurring federal Covid relief funds, thereby artificially increasing the impact of federal funding, the following analyses use data from 2019 to avoid skewed results.
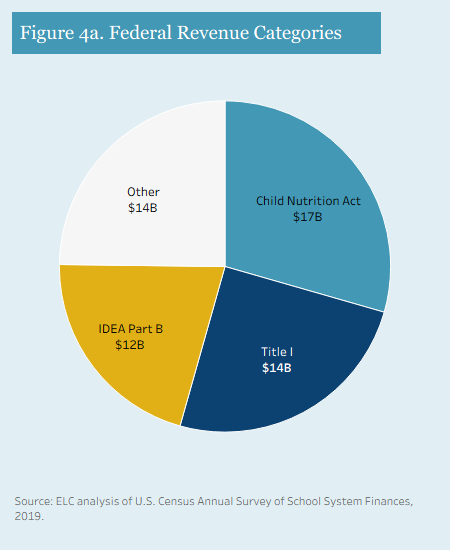
The Annual Survey of School System Finances (F33) data collection, the primary source of data used in this report, does not include detailed information on the types of federal grants that school districts receive, but it does distinguish funding for three of the largest federal grants: Child Nutrition Act, Title I, and IDEA Part B. These three programs represent 75% of the federal funding school districts receive, and each grant includes some measure of student poverty in the allocation formula. The Child Nutrition Act funds the National School Lunch Program through which districts are reimbursed for school meals according to household income eligibility criteria. Title I is allocated to districts using four different funding formulas that largely rely on Census poverty estimates.23 IDEA Part B is allocated to states and then school districts according to student population, student poverty, and prior IDEA allocations.24 The remaining federal funding is allocated to school districts based on a variety of factors depending on the individual grant.
Funding Level
Figure 4b shows the per-pupil increase that comes from federal revenue allocations and its impact on funding level rankings. Nationally, the federal share of total revenue received by school districts was 9% in 2019, but ranged from a low of 5% (New Jersey and Connecticut) to a high of 17% (Mississippi).25 The combination of varying federal shares and wide disparities in the base funding levels coming from state and local revenue mean that the average per-pupil revenue from federal sources varies significantly by state. For example, the federal share was 9% in both Rhode Island and Utah, but in Rhode Island, a state with above average state and local funding, that amounted to $1,264 per pupil, while in Utah, the state with the second-lowest state and local funding, that figure was $762 per pupil. Utah had the smallest per-pupil funding increase from federal revenue, while West Virginia ($1,773) had the largest. The variation in per-pupil federal funding is affected by the complexity of formula grant allocations, eligibility for grants allocated to specific student populations, and the competitive nature of other federal grants.
While some states see a greater average advantage from federal revenue than others, federal support does not do much to reduce inequities in funding among states. The disparities in funding levels among districts also remain, with the highest funded states still dramatically outspending the lowest funded states. The addition of federal funding also does not dramatically change the relative ranking of states on Making the Grade’s funding level measure. The states that receive the most federal revenue per pupil—West Virginia, Louisiana, Mississippi and Kentucky— only move up in funding level rank between two and four positions.

Funding Distribution
While federal revenue doesn’t change funding inequities among states, within-state funding distribution is impacted. In fact, because most federal funding is allocated relative to student poverty or other measures that are often correlated with student poverty (English learner status, migrant status, rural location), we would expect that the allocation of federal funds would lead to a more progressive, within-state distribution of revenue. And in fact, we find that in nearly all states the addition of federal funds does lead to greater progressivity (Figure 4c). This is true regardless of the underlying distribution of state and local funding. In other words, federal revenue is, for the most part, creating more equitable funding systems, even in states that are already fairly progressive.
Alaska, a state with a progressive distribution of state and local revenue, is the only state whose distribution has not improved significantly with the addition of federal funds.26 In the other 47 states analyzed here, the funding distribution ratio between predicted funding in high- and low-poverty districts improved by between 6 and 26 percentage points. For example, in West Virginia, state and local revenue distribution was slightly regressive, with high-poverty districts expected to receive about 6% less per-pupil than low-poverty districts. With the addition of federal funds, however, the distribution swings slightly to the progressive side, with high-poverty districts expected to receive about 5% more than low-poverty districts.
In total, federal revenue made 18 already progressive states, such as Utah and Nebraska, even more progressive and 13 otherwise flat (neither progressive or regressive) states at least slightly progressive, while two states improved from regressive to modestly progressive (Kentucky and Michigan). Eight states moved from regressive to flat. But in seven of the most regressively funded states, including Nevada and Pennsylvania, the overall distribution was still regressive even though the addition of federal revenue improved equity among districts.
Federal Funding Improves Equity
While these results show that federal funding has been far from a magic bullet dramatically improving between-state or within-state funding equity, in most states these resources do contribute to more equitable funding levels between high- and low-poverty districts. Proposals to significantly reduce federal funding or give states more flexibility in how federal funds are distributed to districts within the state could have a significant negative impact on school funding fairness. Higher poverty districts, which disproportionately rely on federal funding programs, are most likely to be severely affected by federal funding losses or reallocations. Instead of reducing federal investments or loosening federal oversight, Congress must act to strengthen federal programs to further reduce inequities in education and incentivize states to improve their school funding formulas.

Putting It All Together
Making the Grade provides an overview of school funding fairness in the states through the examination of three interrelated factors (Table 1). We urge readers to consider each state’s rankings on the three measures collectively and not in isolation. In some cases, a state’s stellar performance in one area is completely undermined by its poor performance in another.
Some key takeaways:

- In 2023, no states earned As on all three funding fairness indicators (level, distribution, effort). Wyoming, which previously held this distinction, dropped to a B on funding effort.
- California’s investment in a new, more equitable school funding formula is paying off: The state dramatically improved on all three measures of funding fairness and now has the second most progressive distribution of funding in the country. Importantly, research convincingly demonstrates that those investments have paid off in terms of student achievement and other measures of success.27
- Many states have high funding levels but a flat or regressive distribution of funding, necessitating school finance reforms that better allocate revenue according to student need (Connecticut, Illinois, Maine, Michigan, New Hampshire, New York, New Jersey, and Pennsylvania).
- Of the 19 states that earned a D or F on funding level, 13 also earned a D or F on effort (the rest earned Cs). These states are not leveraging their economic capacity to better fund public schools. Raising their effort to be more in line with the national average would significantly raise funding levels.
- Florida, Idaho, and Tennessee have the unenviable distinction of earning Fs across all three indicators. These states have low funding levels, due at least in part to a low effort to raise revenue relative to their economic capacity. Those funds are also distributed regressively so that high-poverty districts get less funding, and therefore, fewer resources than wealthier districts.28

Conclusion
The findings of this edition of Making the Grade make clear that school finance reform should be a significant priority in states across the country. Too few states have finance systems that adequately and equitably support all students. The nation’s public schools are currently facing a litany of challenges, from continued Covid-related learning delays and mental health concerns to racial and economic achievement gaps, inadequate facilities, teacher shortages, and more.29 These problems are exacerbated, if not directly caused, by inadequate and inequitable school funding policies that deny students the resources they need to succeed.
A state’s responsibility to develop and implement a fair funding system has become an even greater priority, given proposed policy changes at the federal level. The dismantling of the U.S. Department of Education, though challenged on multiple fronts, is already underway. Funding for federal programs that support the country’s most vulnerable students is being threatened: The Department has effectively eliminated offices that monitor and support programs for English learners and students with disabilities, among others; research and evaluation contracts to support improved student outcomes have been canceled; and enforcement of students’ civil rights has stalled.
In this challenging climate, advocacy efforts in support of public education must be directed at local communities, state legislatures, and Congress. Research has proven that resources matter when it comes to students’ educational success, and that more vulnerable students benefit from more resources.30 Sustaining, protecting and increasing those resources, therefore, is crucial, especially in the face of federal cuts and soaring education- and child-related needs at the state and local levels. Our hope is that Making the Grade can be a useful tool for public education supporters as they encourage policymakers to take responsibility for providing adequate learning opportunities for each and every child.
Endnotes
- Lieberman, M. (2025). Trump Canceled Millions for Special Education Teacher Training. What’s Next? EdWeek. https://www.edweek.org/teaching-learning/trump-canceled-millions-for-special-education-teacher-training-whats-next/2025/09# ↩︎
- Fittes, E.K. & Riser-Kositsky, M. (2025). Sizing Up DOGE’s Education Contract Cuts: What’s Been Targeted. EdWeek Market Brief. https://marketbrief.edweek.org/regulation-policy/an-in-depth-look-at-doge-cuts-to-federal-education-contracts/2025/03 ↩︎
- See Democracy Forward. (2025). Educators, School Districts, and Workers Sue to Stop Trump’s Plan to Dismantle the Department of Education. https://democracyforward.org/work/education-dismantle/; Education Law Center. (2025). Coalition Sues Trump Administration for Dismantling Department of Education, Hurting All Students. https://edlawcenter.org/coalition-sues-trump-administration-for-dismantling-department-of-education-hurting-all-students/ ↩︎
- U.S. Department of Education. (n.d.) Mission of the U.S. Department of Education. https://www.ed.gov/about/ed-overview/mission-of-the-us-department-of-education ↩︎
- Toch, T. & Tracey-Mooney, M. (2025). Latest Education Department Layoffs Threaten Students Most in Need. FutureEd. https://www.future-ed.org/latest-education-department-layoffs-threaten-students-most-in-need/ ↩︎
- Barshaw. J. (2025). Chaos and Confusion as the Statistics Arm of the Education Department in reduced to a skeletal staff of 3. The Hechinger Report. https://hechingerreport.org/proof-points-chaos-confusion-statistics-education/ ↩︎
- Ibid. ↩︎
- Katta, A. (2025). News & Commentary October 14, 2025. OnLabor. https://onlabor.org/october-14-2025/ ↩︎
- Wang, H.L. (2025). Brain Drain at Census Bureau Has Employees Warning About the Country’s Statistics. NPR. https://www.npr.org/2025/04/17/nx-s1-5349435/us-census-bureau-data-decennial ↩︎
- McKillip, M. & Luhm, T. (2020). Investing Additional Resources in Schools Serving Low-Income Students. Education Law Center. https://edlawcenter.org/assets/files/pdfs/publications/Investing_in_Students_Policy_Bri.pdf ↩︎
- This measure does not include figures for Hawaii and the District of Columbia which operate as single district systems. Vermont is also excluded because of reporting inconsistencies. See the Technical Appendix for more information. ↩︎
- Federal revenue varies by state and typically ranges between 4% and 14% of total revenue. U.S. Department of Education, National Center for Education Statistics, Common Core of Data (CCD), “National Public Education Financial Survey (State Fiscal)”, 2019-20 (FY 2020) v.2a ↩︎
- Updated Comparable Wage Index data was not available at the time of publication, so the 2022 index is applied to the FY23 revenue data. ↩︎
- Poverty is measured using the Census definition due to reporting inconsistencies for the National School Lunch Program, the more commonly used metric of school poverty. Census poverty is a stricter measure than either free lunch (130% of Census poverty) or reduced lunch (185%) eligibility. We define high-poverty districts as having a 30% Census poverty rate among school-aged children and low-poverty districts having a 5% poverty rate. For more detail, see the Technical Appendix. ↩︎
- The United States has no established “opportunity to learn” standards that define the resources needed to ensure students have the opportunity to achieve common outcomes. Without a defined standard, it is not possible to determine the cost of the resources and funding levels that would be needed across states to reach that standard. However, Baker, Weber and Srikanth developed the National Education Cost Model to estimate how much school districts must spend to achieve a common outcome, which they set to national average math and reading scores in grades 3-8. While the authors acknowledge that this outcome is a modest goal, the findings clearly demonstrate that many states are not adequately funding students even at this standard, especially in high-poverty school districts.. See Baker, B. D., Weber, M, & Srikanth, A. (2021). Informing Federal School Finance Policy with Empirical Evidence. Journal of Education Finance 47(1):1–25 and Baker, B., Di Carlo, M., & Weber, M. (2024). The Adequacy and Fairness of State School Finance Systems. Albert Shanker Institute. https://www.schoolfinancedata.org/the-adequacy-and-fairness-of-state-school-finance-systems-2024/ ↩︎
- Using the State and Local Implicit Price Deflator, the annual inflation rate dropped from 8% in 2022 to 4% in 2023. ↩︎
- Categorizations are assigned using unrounded funding distribution ratios. The ratios presented in the chart are rounded. ↩︎
- For an overview, see Kaplan, J. (2025). California’s Local Control Funding Formula: Next Steps Toward Equity. Learning Policy Institute. https://doi.org/10.54300/820.131 ↩︎
- Gross domestic product (GDP) is the value of all goods and services produced by each state’s economy. In this report it serves as a measure of each state’s capacity to raise revenue to fund schools. ↩︎
- Impact Aid provides federal support to school districts that include land owned by the federal government or that is otherwise exempt from local tax collections, such as military bases and Indian land. ↩︎
- U.S. Department of Education. (2025). Fiscal Year 2024-FY2026 President’s Budget State Tables for the U.S. Department of Education. https://www.ed.gov/about/ed-overview/annual-performance-reports/budget/budget-tables/fiscal-year-2024-fy-2026-presidents-budget-state-tables-us-department-of-education ↩︎
- Trump. D.J. (2025). Improving Education Outcomes by Empowering Parents, States, and Communities. Executive Order. https://www.whitehouse.gov/presidential-actions/2025/03/improving-education-outcomes-by-empowering-parents-states-and-communities/ ↩︎
- Reber, S. & Gordon, N. (2023). A Deep Dive on How Title I funds are Allocated. The Brookings Institution. https://www.brookings.edu/articles/a-deep-dive-on-how-title-i-funds-are-allocated/ ↩︎
- Dragoo. K.E. (2019). The Individuals with Disabilities Education Act (IDEA) Funding: A Primer. Congressional Research Service. https://www.congress.gov/crs-product/R44624# ↩︎
- For consistency, we are still considering federal Impact Aid and Indian, Native Hawaiian, and Alaska Native Education Aid as state and local revenue in these analyses. Both programs were flat funded in President Trump’s proposed FY26 budget. ↩︎
- Note that we are still considering federal Impact aid and Indian, Native Hawaiian, and Alaska Native Education Aid as state and local revenue in these analyses. ↩︎
- Johnson, R. (2023). School funding effectiveness: Evidence from California’s local control funding formula. Learning Policy Institute. https://doi.org/10.54300/529.194 ↩︎
- Not only are these three states using unfair and inequitable policies to fund their schools, but they are also expanding privatization through universal public school voucher programs that are further eroding investments in their public schools. See Dutton, A. (2025). Idaho Gave Families $50M to Spend on Private Education. Then It Ended a $30M Program Used by Public School Families. (2025). ProPublica. https://www.propublica.org/article/idaho-vouchers-public-school-funding-cuts; Brown. M. (2025). Tennessee to Give More Average Per-Pupil Funding to Voucher Participants than Public School Students. Chalkbeat Tennessee. https://www.chalkbeat.org/tennessee/2025/08/19/voucher-amoung-public-school-funding-formula-tisa/; Dollard, N. & McKillip, M. (2025). Florida Continues to Drain Much-Needed Funds Away from Public Schools to Private and Home-School Students. https://www.floridapolicy.org/posts/florida-continues-to-drain-much-needed-funds-away-from-public-schools-to-private-and-home-school-students ↩︎
- Barshay. J. (2025). A Dismal Report Card in Math and Reading. The Hechinger Report. https://hechingerreport.org/naep-test-2024-dismal-report/; Learning Policy Institute. (2025). An Overview of Teacher Shortages: 2025 [Fact sheet] https://learningpolicyinstitute.org/product/overview-teacher-shortages-2025-factsheet; Learning Policy Institute. (2025). Student Mental Health and Education [Fact sheet] https://learningpolicyinstitute.org/product/student-mental-health-education-factsheet ; Gallagher, M. & Kort, A. (2025). Urban Institute. https://www.urban.org/urban-wire/access-high-quality-school-facilities-varies-across-and-within-districts-advocates-and ↩︎
- See Education Law Center. (2023). Money Matters: Evidence Supporting Greater Investment in PK-12 Public Education. https://edlawcenter.org/assets/files/pdfs/School%20Funding/Money%20Matters%20Talking%20Points.pdf ↩︎