Discussions of public school spending in New Jersey often focus on simple comparisons of per pupil levels that fail to accurately reflect the complexity of factors driving the cost of education and the variations among school districts. The NJ Department of Education (NJDOE) Taxpayer’s Guide to Education Spending “Total Spending per Pupil” lumps in costs that are not connected to student instruction, such as transportation, debt, capital spending, and pension payments. None of these have any educational component and can vary widely among districts. But even if those costs are removed, as in the NJDOE’s “Budgetary Per Pupil Cost,” there is still no recognition that differences in district student populations contribute to differences in spending. In other words, while “Budgetary Per Pupil Cost” shows how much each district spends, it does not consider the demographic differences that require dramatically different levels of resources and spending.
A much more accurate way to examine funding levels across New Jersey school districts is to compare actual spending to the levels determined to be adequate in the state’s school funding formula, the School Funding Reform Act (SFRA). This is known as the SFRA Adequacy Spending Target. The formula defines an “adequacy budget” for each district, that is, how much funding is needed to deliver a constitutionally required “thorough and efficient” education to all students. This adequacy budget is a district’s minimum spending target to deliver the state’s required curricular content standards to students.
HOW THE SFRA WORKS
New Jersey’s SFRA is known as a “weighted student” formula because it defines adequate funding levels based on each district’s unique student composition. An adequacy budget is calculated for each district by attributing a “base” level of per pupil funding for each resident student and the additional funding needed for students who require greater resources: students in higher grades, students from low-income families, English learners (EL), and students with disabilities.
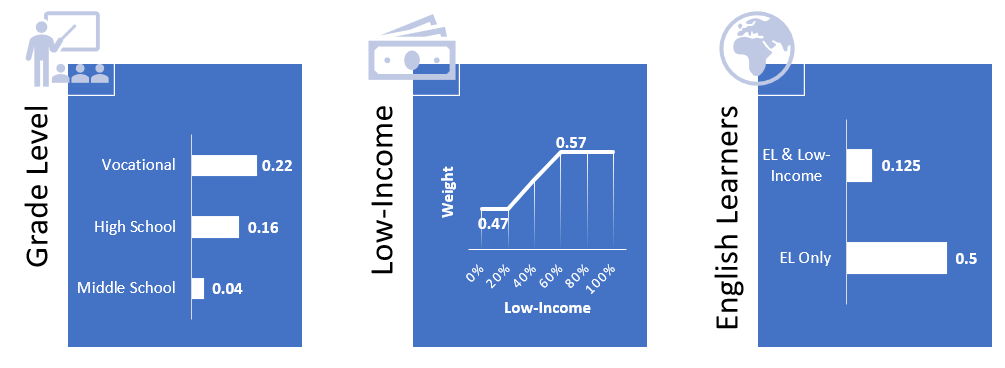
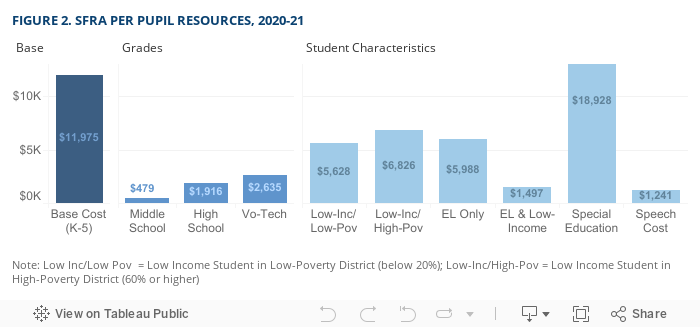
The additional funds for grade level, low-income and ELs, are expressed as “weights,” or a fraction of the base cost (see Figure 1). Figure 2 shows the funding levels associated with these weights for the 2020-21 school year. For example, a high schooler (.17), from a low-income family in a high poverty district (.57) would count as 1.74 (1+.17+.57) students. This student would generate $20,836 ($11,975*1.74) in funding in the district’s adequacy budget.
FIGURE 1. SFRA WEIGHTS
Funding for special education and speech services is not based on weights but rather applies a “Census method” where all districts receive funding at the state average classification rate, regardless of whether a district’s actual classification rate is higher or lower. The statewide average classification rate was 15.4% in 2020-21. All districts receive a categorical aid for security expenses on a per pupil basis ($84), with a higher allocation (up to $503) for low-income students based on the district’s overall student poverty rate. Districts also receive aid for transportation, which is excluded from this spending analysis since it is not an education expenditure.
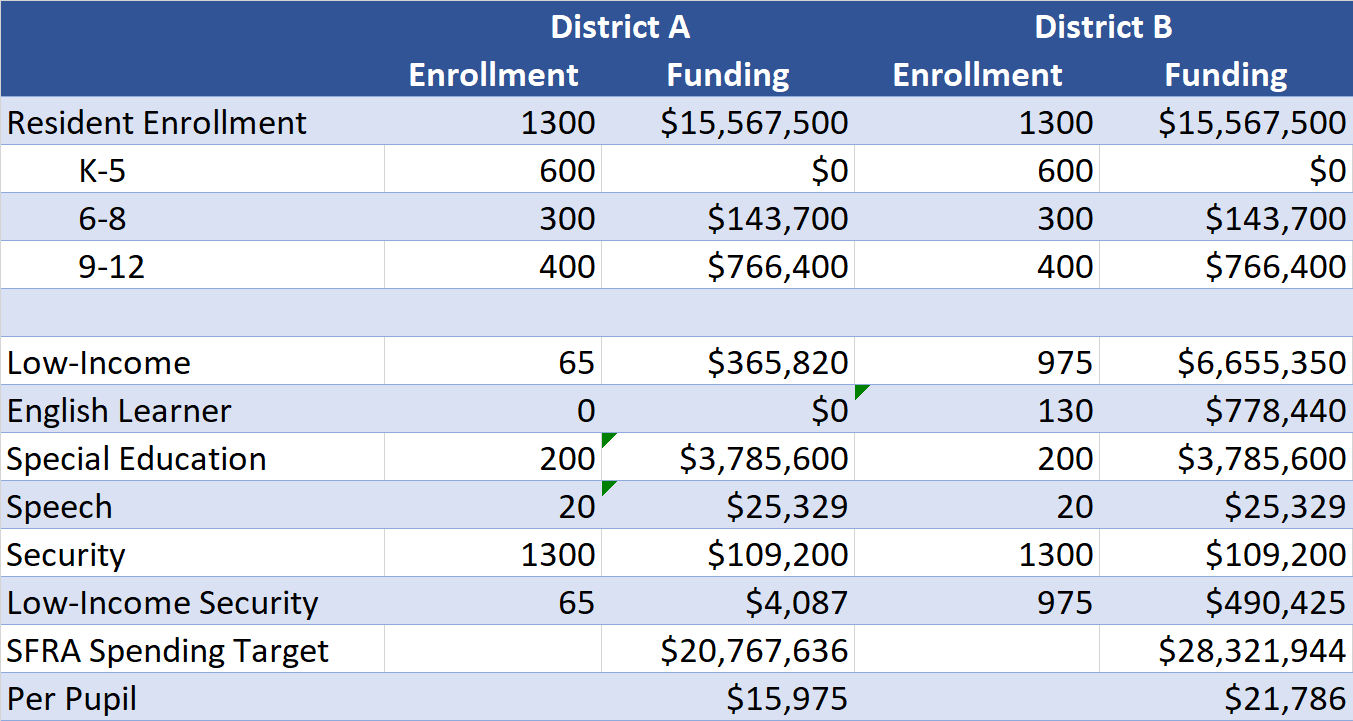
Table 1 presents a hypothetical example of how the SFRA Adequacy Spending Target differs for two districts with the same number of students but with very different student compositions. District A is 5% low-income with no EL students. District B is 75% low-income and 10% English learners. These different population characteristics generate spending targets in District B that are over $7.5 million, or nearly $6,000 per pupil, higher than in district A.
TABLE 1. HYPOTHETICAL SPENDING TARGETS
Definitions
FRA Adequacy Spending Target: Includes all PK-12 SFRA elements, except categorical Transportation Aid, from the 2020-21 NJDOE State Aid Notices. Per pupil figures are calculated using projected Resident Enrollment plus funded PreK students.
Actual Spending: All state and local PK-12 expenditures from 2019-20 User Friendly Budget reports, except Transportation and Tuition. Per pupil figures are calculated using the district’s reported “On Roll” count plus students sent to contracted PreK programs.
SFRA Adequacy Spending Gap: In dollar terms, the difference between a district’s Actual Spending and its SFRA Adequacy Spending Target. In percentage terms, the district’s Actual Spending divided by the SFRA Spending Target.
For a more detailed description of all calculations, see the Appendix.
COMPARING SPENDING AMONG DISTRICTS
SFRA Adequacy Spending Targets vary from a high of $27,290 for Essex County Vocational Schools to a low of $14,116 in Avalon. With that degree of variation in how much districts should spend, it does not make sense to compare how much districts do spend without taking these targets into account.
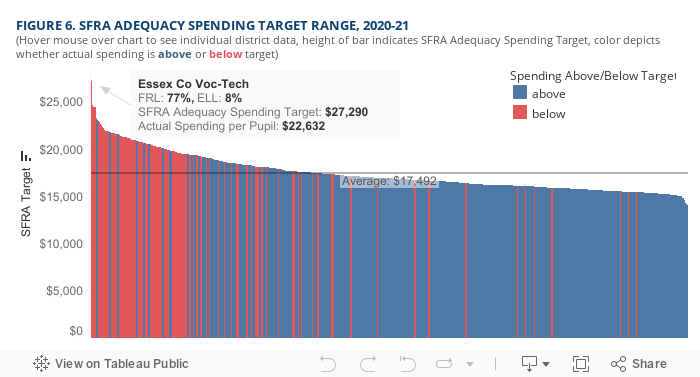
But data published by the NJDOE in its “Taxpayers Guide to Education Spending” encourage users to do just that. By merely grouping districts by grade configuration and enrollment size, they ignore the student demographics that drive SFRA Adequacy Spending Targets. The Taxpayers Guide ignores the fundamental and foundational SFRA principle that certain student populations are more expensive to educate. This leads to misinformed and misleading comparisons of spending among districts that have very different resource needs. The NJDOE presentation encourages fishing for which district is spending “the most” on education and often leads to misguided conclusions about “waste and abuse” in particular districts, with low-income districts often called out for particularly high spending levels.
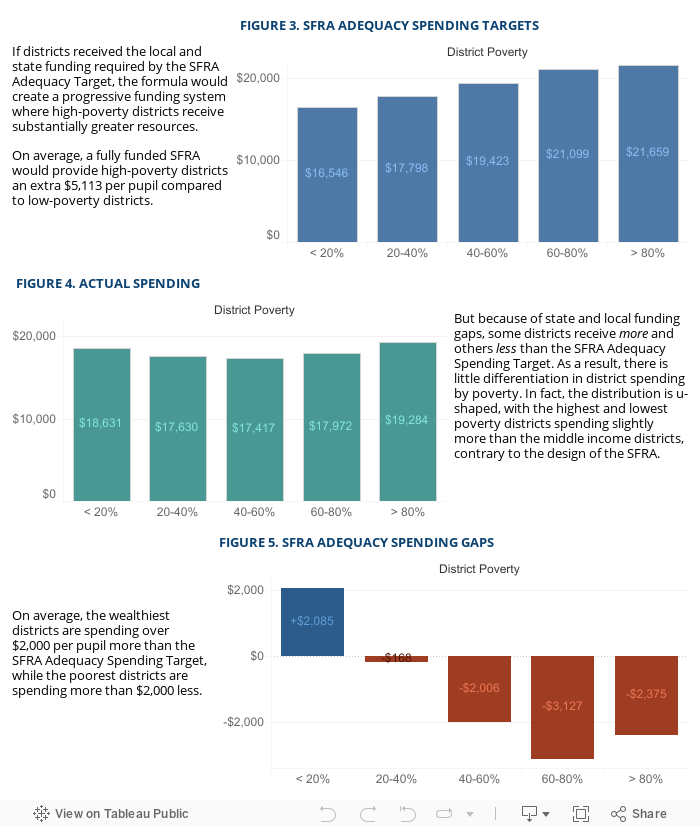
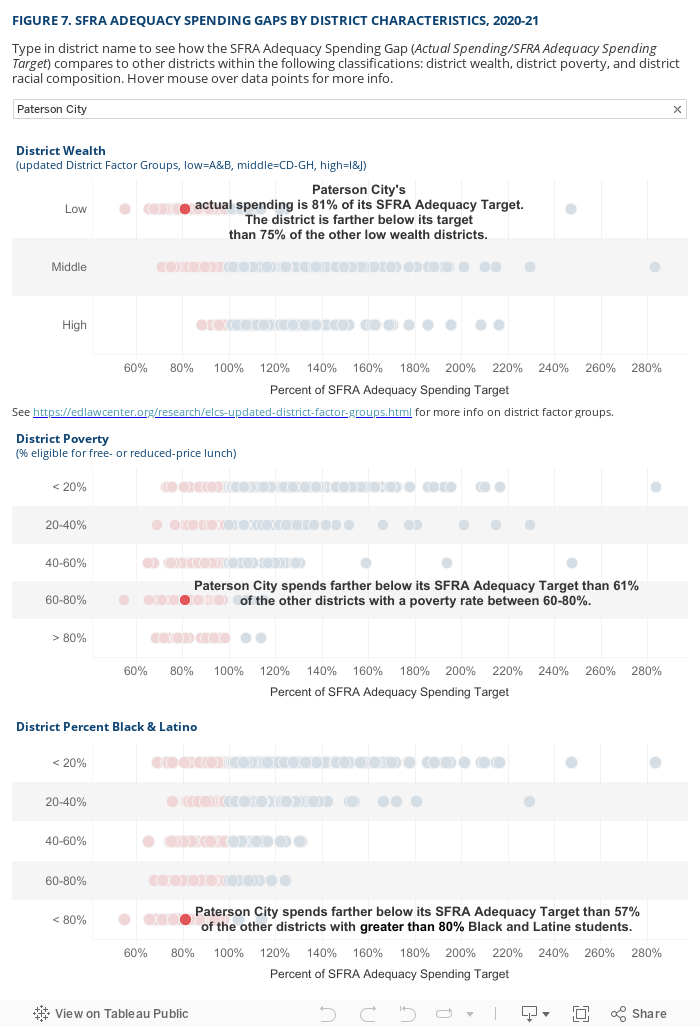
Instead, a more accurate and complete approach is to compare how much each district is spending relative to its SFRA Adequacy Spending Target. SFRA Adequacy Spending Gaps are calculated by comparing a district’s actual spending (state and local funds) to their SFRA Adequacy Spending Targets, expressed either in percentages or per pupil dollars. (See the appendix for a full explanation of how the targets and gaps are calculated.) This method shows whether districts are spending more or less than what the state’s formula defines as adequate for a “thorough and efficient” education. The charts below show districts’ SFRA Adequacy Spending Gaps as percentages within the following classifications: district wealth, student poverty, and racial composition.
DISTRICT SPENDING COMPARISONS
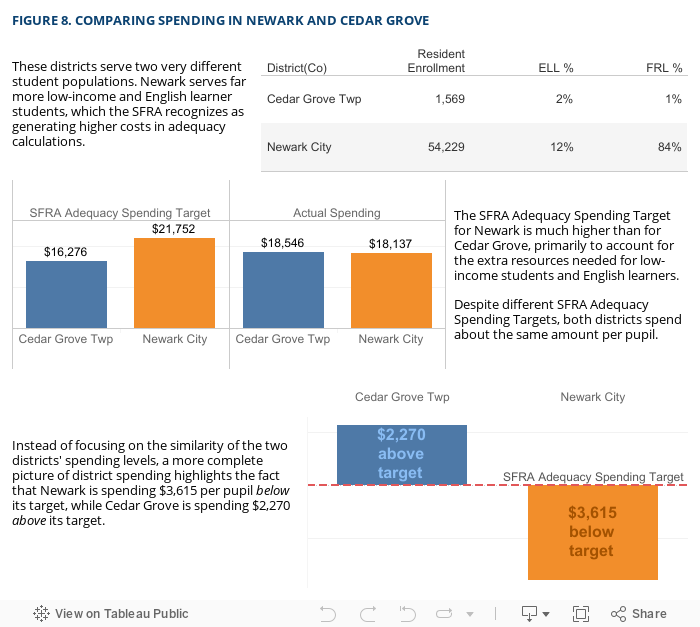
District comparisons that do not take SFRA Adequacy Spending Targets into account can lead to inaccurate claims about district spending, as demonstrated by the example below focusing on two Essex County districts that both spend about the state per pupil average: Newark and Cedar Grove Township.
THE RIGHT WAY TO COMPARE SPENDING
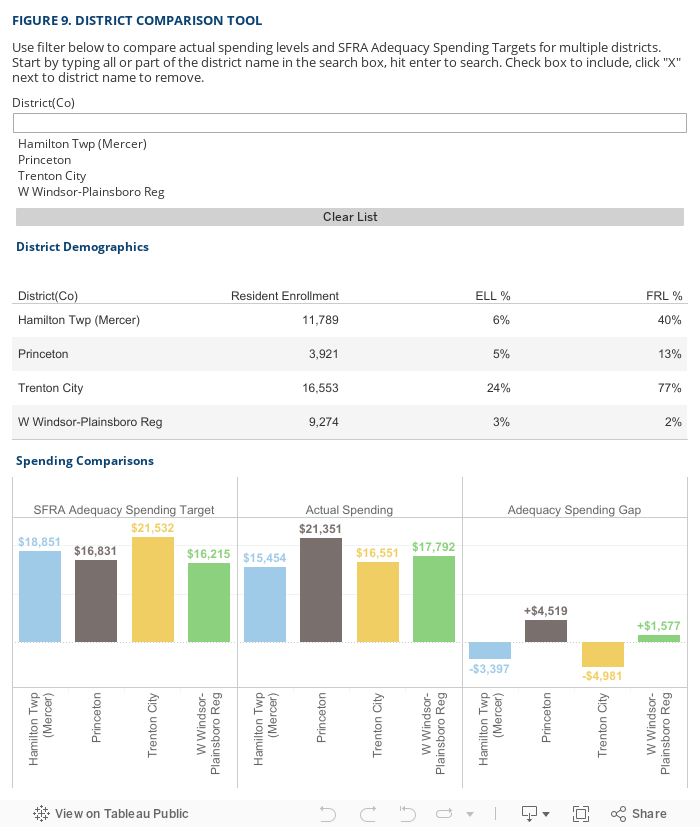
The core principle of the SFRA is that New Jersey districts require varying levels of school funding to meet the needs of their diverse student populations. It makes little sense to compare funding levels among districts without accounting for student differences. Instead, funding comparisons should be anchored to the definition of adequate spending provided by the formula itself: the SFRA Adequacy Spending Targets. By comparing a district’s actual spending to its SFRA target, and then comparing multiple school districts and their proximity or distance from their targets, it’s possible to answer the question: Are New Jersey’s school districts receiving the funding they are entitled to under the state’s school funding formula so they can provide students with a thorough and efficient education as required by the state constitution?
Danielle Farrie, Ph.D., is Research Director for Education Law Center.
Copyright © 2011-2023 Education Law Center, Inc. All rights reserved.