
Summary of Findings
- The average Black (-$1,560) and Latino (-$1,806) student attends a district that is spending far below their SFRA Adequacy Spending Target, while the average white ($1,106) and Asian ($253) student attends a district that spends at or above their Adequacy Target.
- District spending gaps are the result of some combination of state and local revenue gaps. While students of all racial groups, on average, are owed state revenue, the gap for the average Black (-$1,316) and Latino (-$1,495) student is far higher than for the average white (-$152) and Asian (-$456) student. For the average white and Asian student, excess local revenue more than makes up for the state’s underfunding, while for Black and Latino students, local revenue gaps compound the state aid deficits.
- The racial disparities in spending and revenue are even more pronounced when considering the racial segregation of school districts. At the extremes, majority Latino districts are spending over $3,300 below their SFRA target, while majority white districts spend over $1,700 above their SFRA target. About half of all Latino students attend majority Latino districts and over three-quarters of white students attend majority white districts. Majority white districts are the only districts that, in the aggregate, receive more state and local revenue than required under the SFRA.
- The pattern is replicated when considering district racial concentration. Districts of severe Black and Latino racial isolation (more than 80% of the student body) are spending more than $3,200 below their SFRA target, while districts with less than 20% Black and Latino students are spending more than $2,200 above their target.
- These racial disparities in spending and revenue can be reduced if: the SFRA formula is fully funded by the state; Local Fair Share (LFS) calculations are modified to better reflect communities’ ability to pay; and property tax caps are lifted for those communities that are underfunding their local share.
Introduction
New Jersey’s School Funding Reform Act (SFRA) is a “weighted” funding formula, designed to deliver adequate funding based on the unique student needs in every school district across the state. Legislators enacted the formula in 2008 to comply with the New Jersey Supreme Court’s directive in the landmark Abbott v. Burke case that school funding must be based on the actual cost of delivering the State’s academic standards to all students, without regard to district property wealth.
The SFRA included key elements to address long-standing racial and socio-economic disparities in New Jersey’s public school system, most notably additional funding and resources for low-income students and districts with high levels of student poverty. Yet the State Legislature’s continuing failure to fund the formula at required levels for more than a decade has increased, rather than reduced, education inequity among districts.[1] Not only did State elected officials abandon the incremental increases built into the SFRA the year after the formula was enacted, they also cut aid during the Great Recession and then proceeded to flat fund the formula for a decade. Increases since 2019 have set the state in the right direction and made up lost ground. But the sober fact remains that the formula in 2022 is underfunded by over $1 billion in state aid.

The toll of chronic underfunding of the SFRA on generations of students cannot be overstated. More districts and students are now funded below the level the SFRA formula defines as adequate than when the formula was first introduced.[2] Not well understood in the ongoing debates over school funding is the reality that a large percentage of New Jersey’s Black and Latino students attend school in racially segregated districts that also rely heavily on state aid and lack the fiscal capacity to raise funding from the local property tax. Students of color, as a consequence, have lost the most in education resources and opportunities from the continuing failure to fully fund the SFRA formula.
Since its enactment in 2008, Education Law Center has carefully tracked the impact of SFRA underfunding on students in high poverty districts. In this report, we examine for the first time the stark disparities in education funding of Black and Latino students and districts serving disproportionate enrollments of those students. We analyze total spending gaps relative to full formula funding and explore the sources of those gaps through an examination of state and local revenue. Our findings are troubling and underscore the urgent need for the Legislature and Executive to speed up the path to full formula funding, along with other policy changes to fulfill the State’s obligation to provide adequate funding for a thorough and efficient education to all students.

The most glaring feature of New Jersey’s public school system is its high levels of racial and socio-economic segregation, resulting in resource and opportunity gaps that persist to this day. As a consequence of decades of white flight, racist housing policies, and deindustrialization and disinvestment in urban centers, New Jersey’s schools have historically been characterized by the haves and have-nots, with stark disparities in school funding, resources and educational outcomes between more affluent, white suburbs and poorer, urban communities of color. With an overreliance on local property taxes to fund schools, and too little state support for property-poor municipalities, the state’s school finance policy was both inadequate and inequitable.
Public school advocates and lawyers have spent decades working to dismantle these glaring educational disparities through school finance litigation and grassroots advocacy. In the landmark 1990 Abbott v. Burke ruling, the New Jersey Supreme Court declared the state’s school funding system unconstitutional, paving the way for a judicial remedy targeting additional resources to 31 of the state’s poorest, and also most racially isolated, school districts. The 1990 Abbott II ruling, and several that followed over the decade, required the State of New Jersey to provide these districts with adequate funding, including additional funding to address student poverty; universal, high-quality preschool for all three- and four-year-old’s; and state-funded improvements to dilapidated and crumbling school facilities. These investments helped New Jersey increase its standing on national assessments and make progress in closing racial achievement gaps in the early 2000s.[3]
Though the Abbott remedies successfully addressed many of the issues of New Jersey’s racially isolated, urban communities, New Jersey schools beyond the Abbott districts were becoming increasingly diverse, both racially and socioeconomically. The dichotomy of urban versus suburban embedded in the Abbott decisions was failing to capture the growing needs of school districts as poverty increasingly spread to suburban communities.
In 2008, to comply with the Abbott mandate for adequate funding, the Legislature adopted the School Funding Reform Act (SFRA) – the first school funding formula that was accepted by the New Jersey Supreme Court as meeting the state’s constitutional obligations to a “thorough and efficient” education. Instead of limiting additional funding to a subset of urban districts, the SFRA promised that all students in all communities would have access to the school funding they need to meet the state’s curriculum standards. Because funding would be based on student need, districts across the state would finally have the resources to reduce economic and racial disparities in educational opportunities and outcomes.
From a racial justice and socio-economic equity lens, the SFRA’s most important features are: 1) the formula targets additional funding to districts based on the number of students from low-income families and who are learning English; and 2) it targets state aid to districts based on their ability to raise local revenue. It is well accepted in educational policy that low-income students and those learning English benefit from additional resources. And because race, class, and immigration status in New Jersey are deeply entwined, addressing both poverty and language acquisition in the formula overwhelmingly benefits communities of color. Secondly, discriminatory housing policies have depressed property values in low-income and racially segregated communities, making it more difficult for them to support their public schools through property taxes. As a wealth-equalized formula, the SFRA provides greater levels of state support to these property-poor communities.
The SFRA’s promise remains unfulfilled, not because the formula is fundamentally flawed but because successive legislatures and governors have resisted appropriating the state revenue to fully fund it. The required state aid increases were abandoned after just one year, and funding languished for the next decade. Wealthier districts that were less reliant on state aid increased funding through local taxes, while poorer districts without that capability fell further behind. Eventually, the progressivity achieved through the Abbott funding remedy was largely erased, rather than strengthened.[4][5]
For New Jersey to retake its place as a national leader in education equity, all students, but especially the Black and Latino students who have endured the impact of chronic school underfunding over the last decade, must be given the educational opportunities they deserve. It is crucial that, in 2022, the Governor and Legislature and Governor Murphy reaffirm their commitment to full funding of the SFRA formula in the next state budget. As this report demonstrates, honoring this commitment will advance the cause of racial justice in New Jersey’s intensely segregated public education system.
SFRA Spending Gaps by Race
The SFRA is a weighted-student formula that delivers additional resources to districts according to the needs of their student population. The formula determines an adequacy budget for each district with a base cost for each student and additional funding in the form of “weights,” or a fraction of the base cost, for students meeting certain criteria. It is widely accepted that certain populations of students — for example those from low-income families, learning English, or with disabilities — benefit from additional funding.[6] This funding can be used to improve teacher quality, create smaller class sizes, extend learning time, and hire support staff, such as counselors and social workers. For example, in 2020-21, the SFRA provided a base cost of $11,975 per pupil, an extra $5,628 for a low-income student in a low-poverty district, and an extra $5,988 for a student learning English. For more on how the SFRA operates, see ELC’s report, “Spending Targets Under the School Funding Reform Act.”
While race is not a factor in determining funding, economic disadvantage is. In New Jersey, race and socioeconomic status are deeply entwined. The average Black and Latino student attends a district that is over 50% economically disadvantaged, while the average Asian and white student’s district is only 21% economically disadvantaged.[7]
Similarly, SFRA funding is tied to English learner status, a characteristic that is also correlated with race in New Jersey schools. The average Black and Latino student attends a district in which English learners (EL) represent 9% and 12% of the student population, respectively, compared to 3% and 4% for white and Asian students (see Figure 1).
Given these conditions, we would expect Black and Latino students, on average, to attend districts with higher spending levels. If districts were funded to the targets defined by the SFRA, Black and Latino students would attend districts with spending levels that are more than $2,000 per pupil higher than white and Asian students (see Figure 2).
By comparing actual spending to the spending targets under the SFRA, a very different picture of racial disparities emerges. The average Latino student in New Jersey attends a district that is $1,806 below the SFRA target. The average Black student attends a district that is $1,560 below the spending target. In contrast, the average Asian and white student attends a district that spends $253 and $1,106 above the SFRA target, respectively.
Definitions
Spending Gaps
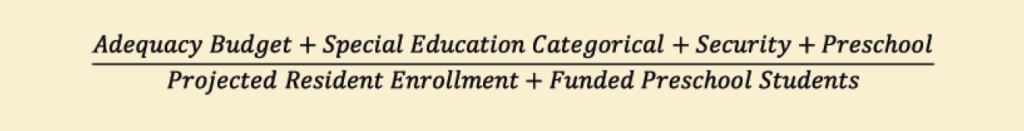
SFRA Adequacy Spending Target
Includes all PK-12 SFRA elements, except categorical Transportation Aid, from the 2020-21 NJDOE State Aid Notices. Per pupil figures are calculated using projected Resident Enrollment plus funded PreK students.
Actual Spending
All state and local PK-12 expenditures from 2019-20 User Friendly Budget reports, except Transportation and Tuition. Per pupil figures are calculated using the district’s reported “On Roll” count plus students sent to contracted PreK programs.
SFRA Adequacy Spending Gap
In dollar terms, the difference between a district’s Actual Spending and its SFRA Adequacy Spending Target. In percentage terms, the district’s Actual Spending divided by the SFRA Spending Target.
Revenue Gaps
State Gaps
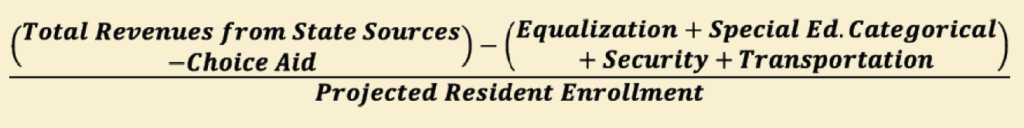
The difference between the state aid required by the SFRA (Equalization, Special Education, Security, Transportation, Educational Adequacy) and the actual state aid received (includes Adjustment Aid and other special state revenue sources such as loans from DOE and emergency aid).
Local Gaps
The difference between the Local Fair Share and the local school tax levy. The LFS is capped at the amount of revenue required to support the district’s adequacy budget. The school tax levy includes the payroll tax in Jersey City and tuition payments from other LEA’s for vocational school districts (these payments compensate for missing county tax levies).
For a more detailed description of all calculations, see the Appendix.
SFRA Revenue Gaps by Race
The SFRA is funded through both state and local revenue, and the formula is wealth equalized so that a district’s contribution is determined by its relative capacity to raise local revenue through property taxes. The NJDOE uses an equalization formula, called the Local Fair Share (LFS), that takes into consideration each municipality’s ability to raise local revenue as a function of property values and personal income. In general, wealthier suburban communities are expected to raise a larger share of their adequacy budget than poorer, urban areas.
When the SFRA was adopted in 2008, the state intended to phase in additional state aid to fully fund its portion of the adequacy budget, but it has so far failed to live up to that obligation. Roughly two-thirds of all districts are still owed additional state aid well over a decade later. Districts also vary in their ability to raise the local revenue required to support their adequacy budget, with some districts raising well above, and others well below, their local obligation. The ability of locally underfunded districts to raise their LFS is further complicated by a state-imposed property tax cap that limits municipalities to an annual 2% increase, regardless of how far below the LFS they may be.[8] In many districts this cap prevents them from making any meaningful progress to meet their LFS.
State Gaps
Latino and Black students, on average, are more likely to live in districts that receive a larger portion of their funding from state aid. Under the SFRA, the average Latino or Black student should receive about $11,000 in state funding, compared to about $4,000 for Asian and white students. While all students are, on average, underfunded in state aid, the average gaps for Black ($1,495) and Latino ($1,316) students are far larger than for white ($152) and Asian ($456) students.
Local Gaps
In contrast to state aid, white and Asian students are more likely to live in districts that are expected to raise a larger portion of revenues through local revenue because they are more likely to live in communities with greater property wealth and higher incomes. The average Black and Latino student lives in a district that is expected to raise just under $10,000 per pupil in local revenue, while the average white and Asian student lives in a district where the local obligation is closer to $14,000 per pupil. Despite the higher local obligations, the average white and Asian student resides in a district raising well above the required amount – $1,000 for the average Asian and over $1,500 for the average white student. In contrast, the average Latino and Black student lives in a district that receives about $500 to $700 less than is required by the SFRA. The concentration of property wealth and high-earning households in white and Asian communities makes it far easier for these districts to exceed their local contribution with lower overall tax rates. In contrast, lower-wealth urban communities with predominately Black and Latino residents face a higher overall tax burden because of their lower property values.[9]
Total Revenue Deficits
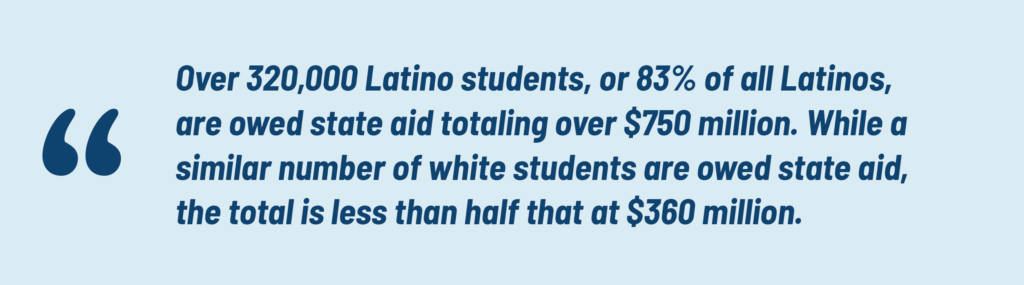
The failure to fully fund the SFRA, both in terms of local and state revenue, clearly has an outsize effect on the state’s Black and Latino student populations. Over 320,000 Latino students, or 83% of all Latinos, are owed state aid totaling over $750 million. While a similar number of white students are owed state aid, the total is less than half that at $360 million. The majority of Black and Latino students live in districts that are owed local revenue, compared to only about a third of Asian and white students.
Funding Disparities and Racial Segregation
Spending Gaps
Not surprisingly, the racial spending gaps discussed above are further exacerbated for students who are concentrated in school districts segregated by race. Majority Latino districts, where more than half the student population is Latino, have the greatest spending gap at over $3,300 per pupil below the SFRA target. Approximately half of Latino students statewide attend districts in which they are the majority. In contrast, majority white districts spend over $1,700 per pupil above the SFRA targets. Three-quarters of white students attend majority white districts.
There is variation in the district-level spending gaps within these groupings. For example, Asbury Park and Orange are both majority Black districts, but the former is spending over $3,000 above the SFRA target, while the latter is spending over $4,000 below the SFRA target. In majority white districts, over two dozen mostly small districts are spending over $10,000 per pupil above their target, while a handful of others are spending more than $4,000 below the target.
Revenue Gaps
In the aggregate, all district types, except for majority white districts, are owed state revenue, though this varies from a low of $371 per pupil in majority Asian districts to a high of $2,626 in majority Latino districts. Majority Black and majority Latino districts are also owed additional local revenue, $1,353 and $1,530 respectively. Majority white districts are the clear outlier, receiving slightly more state aid and significantly more local revenue ($1,916) than required by the SFRA. Again, there is significant variation within these district groupings.
A Note on Charter School Students
The New Jersey Department of Education collects racial demographics at the school level through the Fall Survey collection. Because charter schools are treated as their own districts in this data collection, the racial composition of the school districts in this analysis excludes charter students and only reflects the composition of students in district-run schools. Because charter schools are funded through students’ district of residence, spending gaps will follow them to their charter schools. However, publicly available data does not allow us to analyze those funding gaps by the race of the charter student, so they are excluded from these analyses. Black and Latino students make up approximately 85% of New Jersey’s 55,000 charter school population.
Funding Disparities and Racial Concentration
Another way to view racial disparities is to categorize districts by the concentration of particular racial groups. For example, when comparing districts by the percentage of students who are either Black or Latino, we find a clear spending gap pattern. Districts that serve less than 20% Black and Latino students (largely districts of white isolation) spend more than $2,200 per pupil above the SFRA Adequacy Target, while districts with over 80% Black and Latino students spend more than $3,200 below the target.
Similarly troubling patterns are seen for state and local revenue gaps. Districts with fewer than 40% Black and Latino students are, in the aggregate, receiving about the correct amount of state aid, while districts with larger Black and Latino student concentrations have significant state revenue gaps, up to $2,539 in districts that are over 80% Black and Latino. Similarly, districts below 40% Black and Latino, in the aggregate receive more local revenue than required by the SFRA, while districts that are greater than 40% Black and Latino are owed significant local revenue.
Recommendations
Without adequate funding, districts cannot be expected to deliver the constitutionally guaranteed “thorough and efficient” education to which New Jersey students are entitled. While the SFRA was intended to deliver adequate funding levels across the state, the underfunding of state aid and inconsistencies in local funding have led to enormous disparities in districts’ ability to deliver essential educational resources. Lower wealth communities of color are disadvantaged both by the state’s refusal to fully fund the formula and by the difficulty of raising the required local share and are, on average, funded well below the SFRA’s required levels. Higher wealth, largely white districts, on the other hand, are less reliant on state aid and continually raise above their local share, exacerbating inequities. These disparities guarantee that a student’s racial background is a significant predictor of the educational resources they are provided and, therefore, the quality of education they receive. Fully funding the SFRA would move the state towards greater racial equity in school funding. However, failures in state policy have prevented the formula from reaching its full potential. To begin to remedy these racial disparities, the state must take the following actions:
1. Fully fund the state portion of the SFRA
The state must meet its obligation to provide the state funding that is defined through the SFRA. After a decade of near neglect, the past few budget cycles have invested considerable state revenue to accomplish this goal. This trend must continue until the formula is fully funded.
2. Lift property tax caps for all districts below their Local Fair Share
The underfunding of the local contribution also contributes to spending gaps under the SFRA. About one-third of districts are raising a local tax levy that is below their Local Fair Share. The state-imposed 2% property tax cap prohibits many districts from meeting their local obligation. Districts that need to raise additional local revenue to reach their Local Fair Share should not be prevented from raising that revenue in a timely fashion. Lifting the property tax cap for districts below their LFS would allow them to raise the local revenue that is required by the SFRA and necessary to reach their adequacy targets.
3. Analyze the Local Fair Share calculations
The SFRA was signed into law with a provision to revisit the LFS, but this proposed study was eventually removed from law. The state must immediately commission an independent study to determine whether the LFS calculations are fair and equitable, especially as it relates to racial and economic justice. This study must determine whether the LFS places unrealistic tax burdens on poor communities and communities of color, exacerbating decades of systemic economic and racial injustice perpetuated by real estate markets and land development. In other words, is the wealth equalization process in the SFRA truly fairly distributing the property tax burden across the state?
Danielle Farrie, Ph.D., is Research Director for Education Law Center.
Appendix
SFRA Adequacy Spending Target
The per pupil funding allocated to each school district under the state’s school funding formula – the School Funding Reform Act. The district’s adequacy budget is calculated as a base cost per pupil and additional funding for students who require greater resources: students in higher grades, students from low-income families, English learners, and students with disabilities. Districts also receive security aid, preschool aid, and a portion of special education aid as categorical grants. Transportation funding is excluded. Data sourced from NJ Department of Education’s (NJDOE) annual state aid notices.
Actual Spending
Per pupil state and local expenditures on PK-12 education. Tuition costs for send/receive relationships, out-of-district placements and transportation costs are excluded, as these costs are outside of the district’s adequacy calculation. Enrollment is the number of “on roll” students, which excludes tuition students and out-of-district placements but includes charter and Renaissance students. Data sourced from NJDOE’s annual User-Friendly Budget (UFB) reports. Analysis is limited to the most recent school year with actual, not estimated, expenditure and enrollment data.

State Revenue Gap
The difference between the state aid required to support the SFRA’s Adequacy Budget and the state education revenue received. The data source for the required state aid is the annual State Aid Notices from NJDOE and the source for the actual revenue is the NJDOE’s User Friendly Budgets.
Local Revenue gap
The difference between the Local Fair Share (LFS) required to support the SFRA’s Adequacy Budget and the local revenue received. The data source for the required state aid is the annual State Aid Notices from NJDOE and the source for the actual revenue is the NJDOE’s User Friendly Budgets.

Spending Gap Data
A district-level table of spending gap data is available here.
Endnotes
[1] Abbott Districts: School Funding Still Unconstitutional. Education Law Center, March 2019.
[2] Nearly 200 New Jersey Districts are $2.5 Billion Below Constitutional Funding Level. Education Law Center, February 17, 2021.
[3] Darling-Hammond, Linda. 2015. The Flat World and Education. New York: Teachers College Press.
[4] New Jersey’s Abbott Districts: State Allows School Funding to Fall Further Below Constitutional Levels. Education Law Center, March 20, 2019.
[5] Funding Gaps Widen between New Jersey’s Low and High Poverty Schools. Education Law Center, May 17, 2017.
[6] McKillip, Mary and Theresa Luhm. Investing Additional Resources in Schools Serving Low-Income Students. Education Law Center, April 2020.
[7] This and all subsequent statewide averages by race are calculated using a student enrollment weighted average of district-level data. For example, to determine the district low-income rate for the average Black student, we 1) take the sum of each district’s low-income rate multiplied by the number Black students in that district, then 2) divide that total by the total number of Black students in the state.
[8] Two Steps to Reduce the Number of New Jersey Students in Underfunded Schools. Education Law Center, February 27, 2019.
[9] Evan, Tim. Where Do New Jersey’s Property Tax Bills Hit the Hardest? New Jersey Future, February 15, 2021.