Introduction
Education Law Center’s Making the Grade is an annual overview of the condition of school finance in the states. The current report presents a picture of school funding in 2020-2021, the first full school year of the Covid-19 pandemic and the most recent data available. The high-level picture is a familiar one:
- Vast disparities in per-pupil funding levels persist with the highest funded state (New York) spending two and a half times more per pupil than the lowest funded state (Idaho), even after adjusting for regional cost differences.
- Far too few states progressively distribute funds to high-poverty districts: more than half of the states evaluated have either flat or regressive funding distributions that disadvantage high-poverty districts.
- Many states lack the fiscal effort that is required to adequately fund schools: the worst funded states are often guilty of low effort, indicating a failure to prioritize public education. Conversely, many of the highest funded states achieve their position through a high degree of fiscal effort.
Economic uncertainty led some states to pull support from public schools in 2020-2021:
- Nationally, PK-12 education saw the smallest annual increase in combined state and local funding since the Great Recession.
- Fourteen states reduced total state and local revenue for education at exactly the moment when schools needed more resources to deal with the unprecedented challenges of interrupted learning, virtual or hybrid schedules, and health and safety concerns.
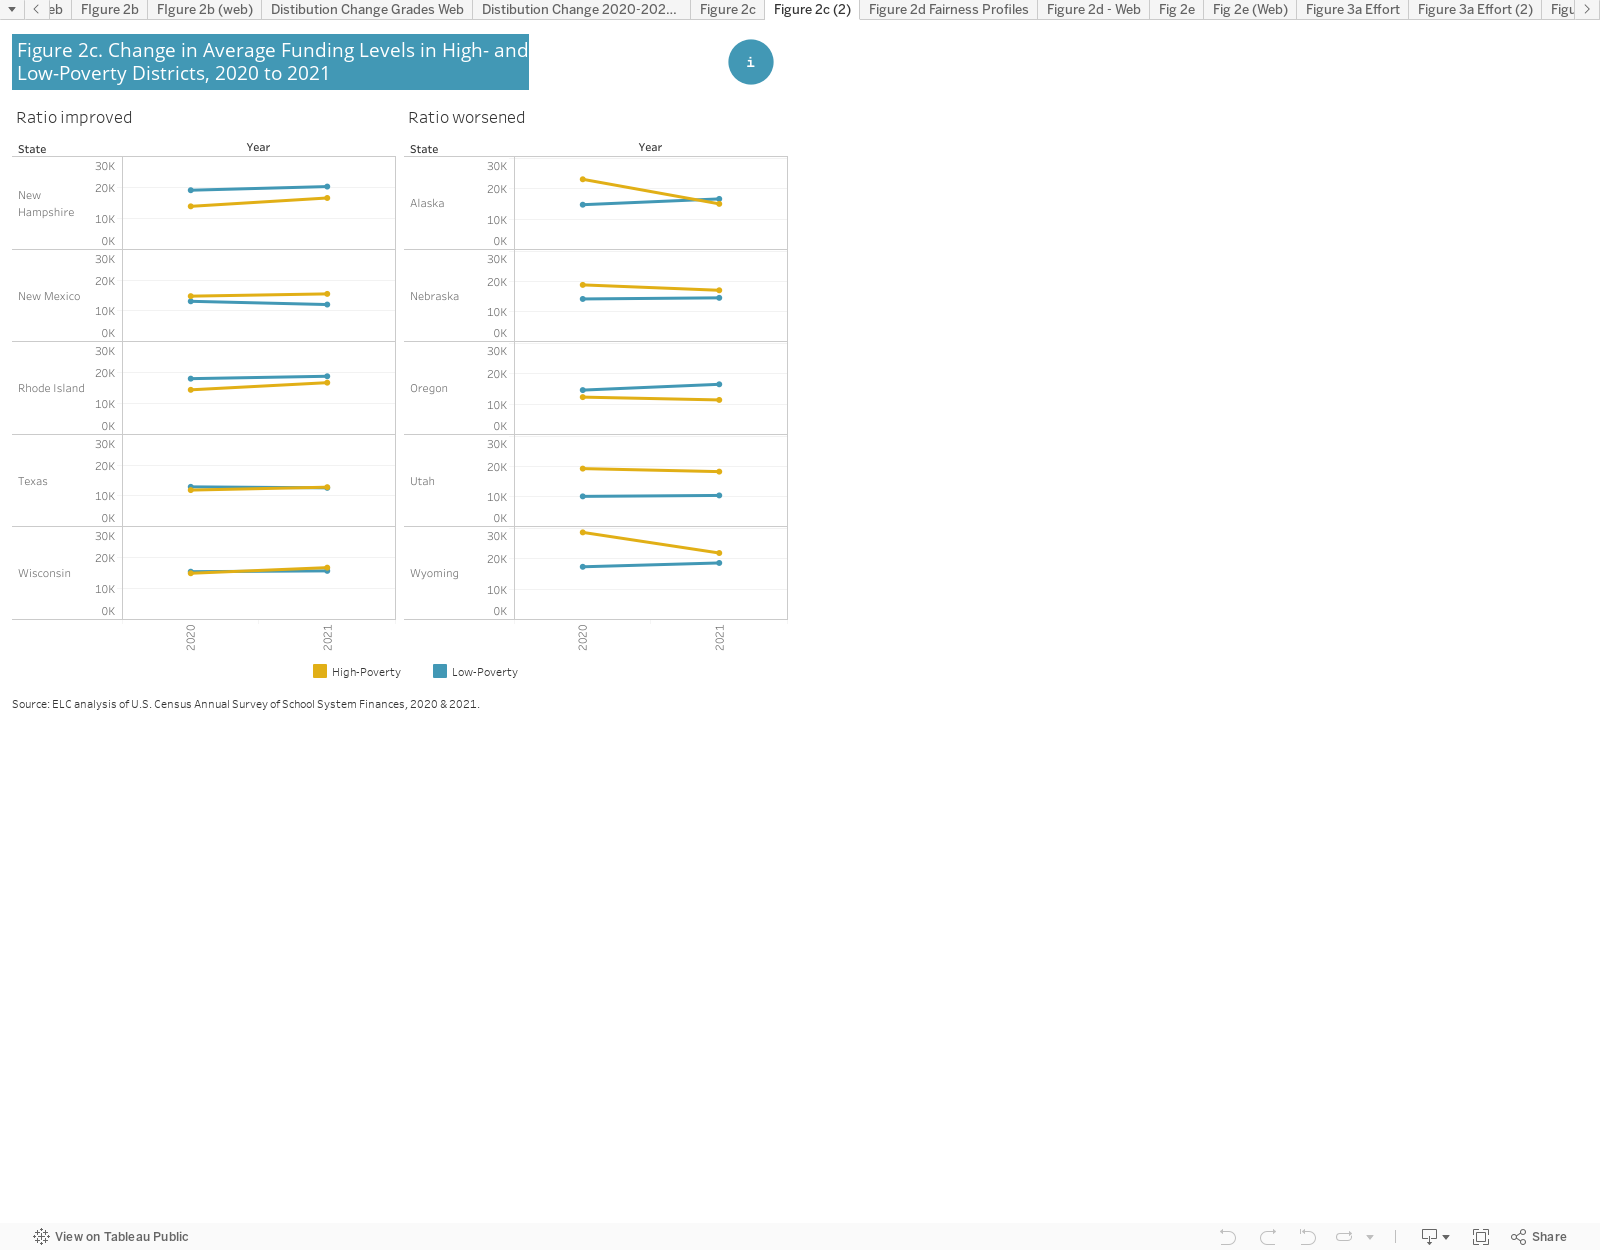
- In Alaska, Nebraska, Oregon, Utah, and Wyoming, declining revenues disproportionately affected high-poverty districts and caused these states to become either less progressive or more regressive.
- The decline in funding effort in every state except Missouri demonstrated that school funding investments lagged far behind unexpected economic growth.
Setting School Budgets as the Pandemic Emerged
In the spring of 2020, most states were tackling their fiscal year 2021 budgets amidst the uncertainty and chaos of the early days of the pandemic. When the country shut down in March 2020, those states were in the negotiations phase of their state budget cycles where state legislatures review and respond to governors’ budget proposals.[1] Legislators were faced with unusual circumstances as the accuracy of revenue forecasts set before the pandemic were called into question. Sales and income tax predictions, which make up the majority of state revenue, were uncertain as the potential for an extended economic shutdown loomed. Several states suspended legislative sessions in the middle of budget negotiations, instituted temporary budgets while awaiting more accurate forecasts, or, like New Jersey, simply extended the 2020 fiscal year from June to September.[2]
Though revenue trends proved not to be as grim as initially feared, many states maintained a conservative approach.[3] Many states pulled back on education funding in FY2021, either by reducing the amount of state or local revenue allocated to districts (e.g., Colorado and Hawaii) or by failing to implement planned funding increases (e.g., New Jersey and Illinois).
Those setbacks were tempered by the influx of federal Elementary and Secondary School Emergency Relief (ESSER) funds. But it is crucial to recognize that federal relief was intended to address the excess or extraordinary costs districts faced in response to the pandemic, not to replace existing state and local support.[4] These relief packages included Maintenance of Effort and Maintenance of Equity provisions to prevent state disinvestment in response to the receipt of federal funds, though these efforts were not fully successful.[5] While this report does not consider federal funding in the evaluation of states’ funding fairness, the availability of these additional resources adds important context to the state and local funding decisions made in 2021 and beyond.
The Urgency of School Finance Reform
The Covid-19 pandemic exposed the preexisting inequity and inadequacy of school funding in many states. The pre-pandemic conditions in too many public schools, including inadequate staffing levels, poor facilities conditions, and lack of technology, contributed to their inability to effectively respond to the public health emergency. Not surprisingly, researchers have found that the pandemic exacerbated economic and racial inequality, with students in the poorest districts falling further behind students in the richest districts.[6]
The federal government recognized that resources targeted to high-poverty districts were needed to address these challenges. But once these relief funds are spent (funds must be obligated by September 2024), states will be left with the inequitable and inadequate funding systems that contributed to the disparate impact of the pandemic on student learning and overall wellbeing in the first place.
State policymakers must continue to address these underlying opportunity gaps with the same level of urgency with which the federal government addressed Covid-related learning disruptions. Sustained increases in school funding, distributed to account for student need and developed within a framework that directly links funding levels to resources, are required to provide all students with the opportunity to achieve curricular standards. State policymakers must make meaningful school funding investments in upcoming state budgets, beginning in FY2025, to avoid harmful cuts and to increase student access to critical educational resources and opportunities.

Making the Grade analyzes the condition of public school funding in all 50 states and the District of Columbia. Using the most recently available data from the 2019-20 school year, the report ranks and grades each state on three measures to answer the key question: How fair is school funding in your state?
The three fairness measure are:
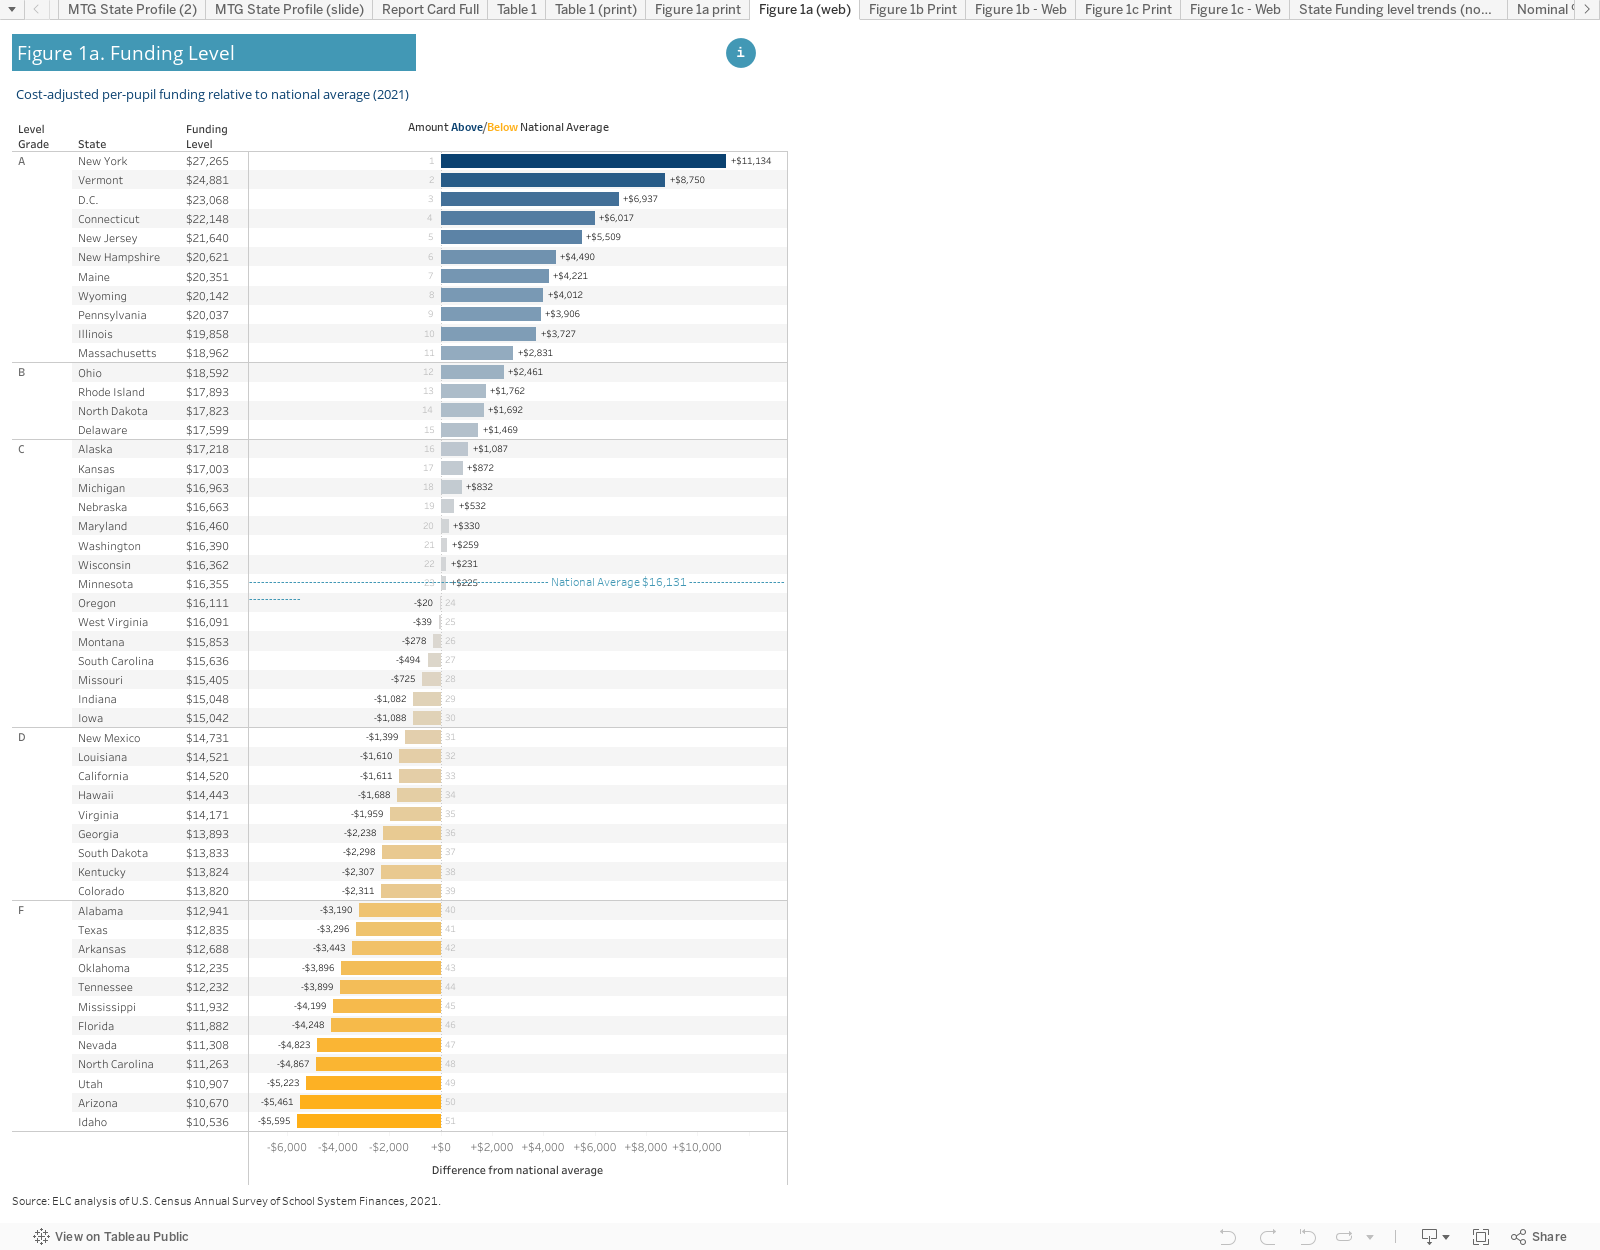
- Funding Level – cost-adjusted, per-pupil revenue from state and local sources (Fig. 1a);
- Funding Distribution – the extent to which additional funds are distributed to school districts with high levels of student poverty (Fig. 2a);[5]
- Funding Effort – funding allocated to support PK-12 public education as a percentage of the state’s economic activity (GDP) (Fig. 3a).
The state rankings and grades on these measures provide crucial data to inform advocates, policymakers, business and community leaders, teachers, parents, and students about the equity and adequacy of public school funding in their state. Making the Grade is designed to assist state residents working to improve the level and distribution of funding for public school students.What Is Fair School Funding?
What Is Fair School Funding?
We define fair school funding as the funding needed in each state to provide qualified teachers, support staff, programs, services, and other resources essential for all students to have a meaningful opportunity to achieve a state’s academic standards and graduate from high school prepared for citizenship, postsecondary education, and the workforce. A fair funding system is the basic foundational building block for high-performing, effective, PK-12 public school systems. Fair funding has two basic components: a sufficient level of funding for all students and increased funding for high-poverty districts to address the additional cost of educating students in those districts. These two components are dependent on a third factor: the effort made by state lawmakers to raise sufficient revenue to support their public schools so they can meet state-established curriculum content and performance objectives.
Why the States?
Unlike other countries, the United States has no national education system. Instead, states, under their respective constitutions, have the obligation to support and maintain a system of free public schools for all resident children. The states, and not local school districts or the U.S. Congress, are the unit of government legally responsible for operating the nation’s public schools and providing the funding necessary to support and maintain those schools.
All states fund their schools through a statewide method or formula enacted by the state legislature. These school funding formulas, or school finance systems, determine the amount of revenue school districts are permitted to raise from local property and other taxes and the amount of funding or aid the state is expected to contribute from state taxes. In annual or biannual state budgets, legislatures also determine the actual amount of funding districts will receive to operate their schools – amounts which do not always align with the state’s funding formula.
Why Does Fair School Funding Matter?
A fair, equitable, and adequate school funding formula is the basic building block of a well-resourced and academically successful school system for all students. A strong funding foundation is even more critical for low-income students, students of color, English learners, students with disabilities, and students facing homelessness, trauma, and other challenges. These students, and the schools that serve them, need additional staff, programs, and supports to put them on the same footing as their peers. Research on the needs of vulnerable student populations for extra academic and academically-related programs and services is compelling, as is growing evidence that increased investments in these students improves academic achievement and other outcomes.[8]

This report utilizes national data sets to analyze the condition of school funding in the states.
Data Sources The U.S. Census Bureau’s Annual Survey of School System Finances (2008-2020), the U.S. Census Bureau’s Small Area Income and Poverty Estimates (2008-2020), and the U.S. Bureau of Economic Analysis’ State Gross Domestic Product reports (2008-2020).
Funding Level is determined by dividing state and local revenue by student enrollment. Federal revenue is not included, except for Impact Aid and Native American education revenue, as they are intended to replace state and local funds. We also exclude revenue for capital outlay and debt service programs. These revenues tend to be uneven from year to year, and one-time or short-term investments may obscure more prevalent funding patterns. Finally, district-level payments to charter schools, private schools, and other school systems that are reported as expenditures are subtracted from the revenue total. These revenues are attributable to students typically not included in the enrollment count. The resulting per-pupil funding levels are adjusted for regional differences using the National Center for Education Statistics’ Comparable Wage Index for teachers.
Funding Distribution utilizes a modified version of the regression-based method developed by Bruce Baker, professor in the School of Education and Human Development at the University of Miami, and published in Is School Funding Fair? A National Report Card (eds 1-7), to model the pattern of funding relative to district poverty within each state. The analysis essentially asks: Once differences in costs related to district size and geography are accounted for, do states provide more or less funding to districts as the poverty rate increases? Using district-level revenue data (as defined above for funding level), the model predicts funding in a high-poverty (30% Census poverty) relative to a low-poverty (5% Census poverty) district. States that provide higher per-pupil funding levels to high-poverty districts are progressive; states that provide less to high-poverty districts are regressive; and states where there is no meaningful difference are flat.
Funding Effort is measured as total state and local revenue (including capital outlay and debt service, excluding all federal funds) divided by the state’s gross domestic product (GDP). GDP is the value of all goods and services produced by each state’s economy and is used here to represent the state’s economic capacity to raise funds for schools.
Grades are assigned using the typical curve. A standardized score is calculated as the state’s difference from the mean or average, expressed in standard deviations. Grades are as follows: A = 2/3 standard deviation above the mean; B = between 1/3 and 2/3 standard deviations above the mean; C = between 1/3 standard deviation below and 1/3 standard deviation above the mean; D = between 1/3 and 2/3 standard deviations below the mean; F = 2/3 standard deviation below the mean.
For more details on report methodology, see the Technical Appendix.
The Fairness Measures
Funding Level
A state’s funding level is measured as the combined state and local revenue for PK-12 education, divided by student enrollment and adjusted to account for regional variation in labor market costs.
A state’s funding level grade is determined by ranking its position relative to other states; the grade does not measure whether a state meets any particular threshold of funding adequacy based on the actual cost of education resources necessary to achieve state or national academic standards. [9]
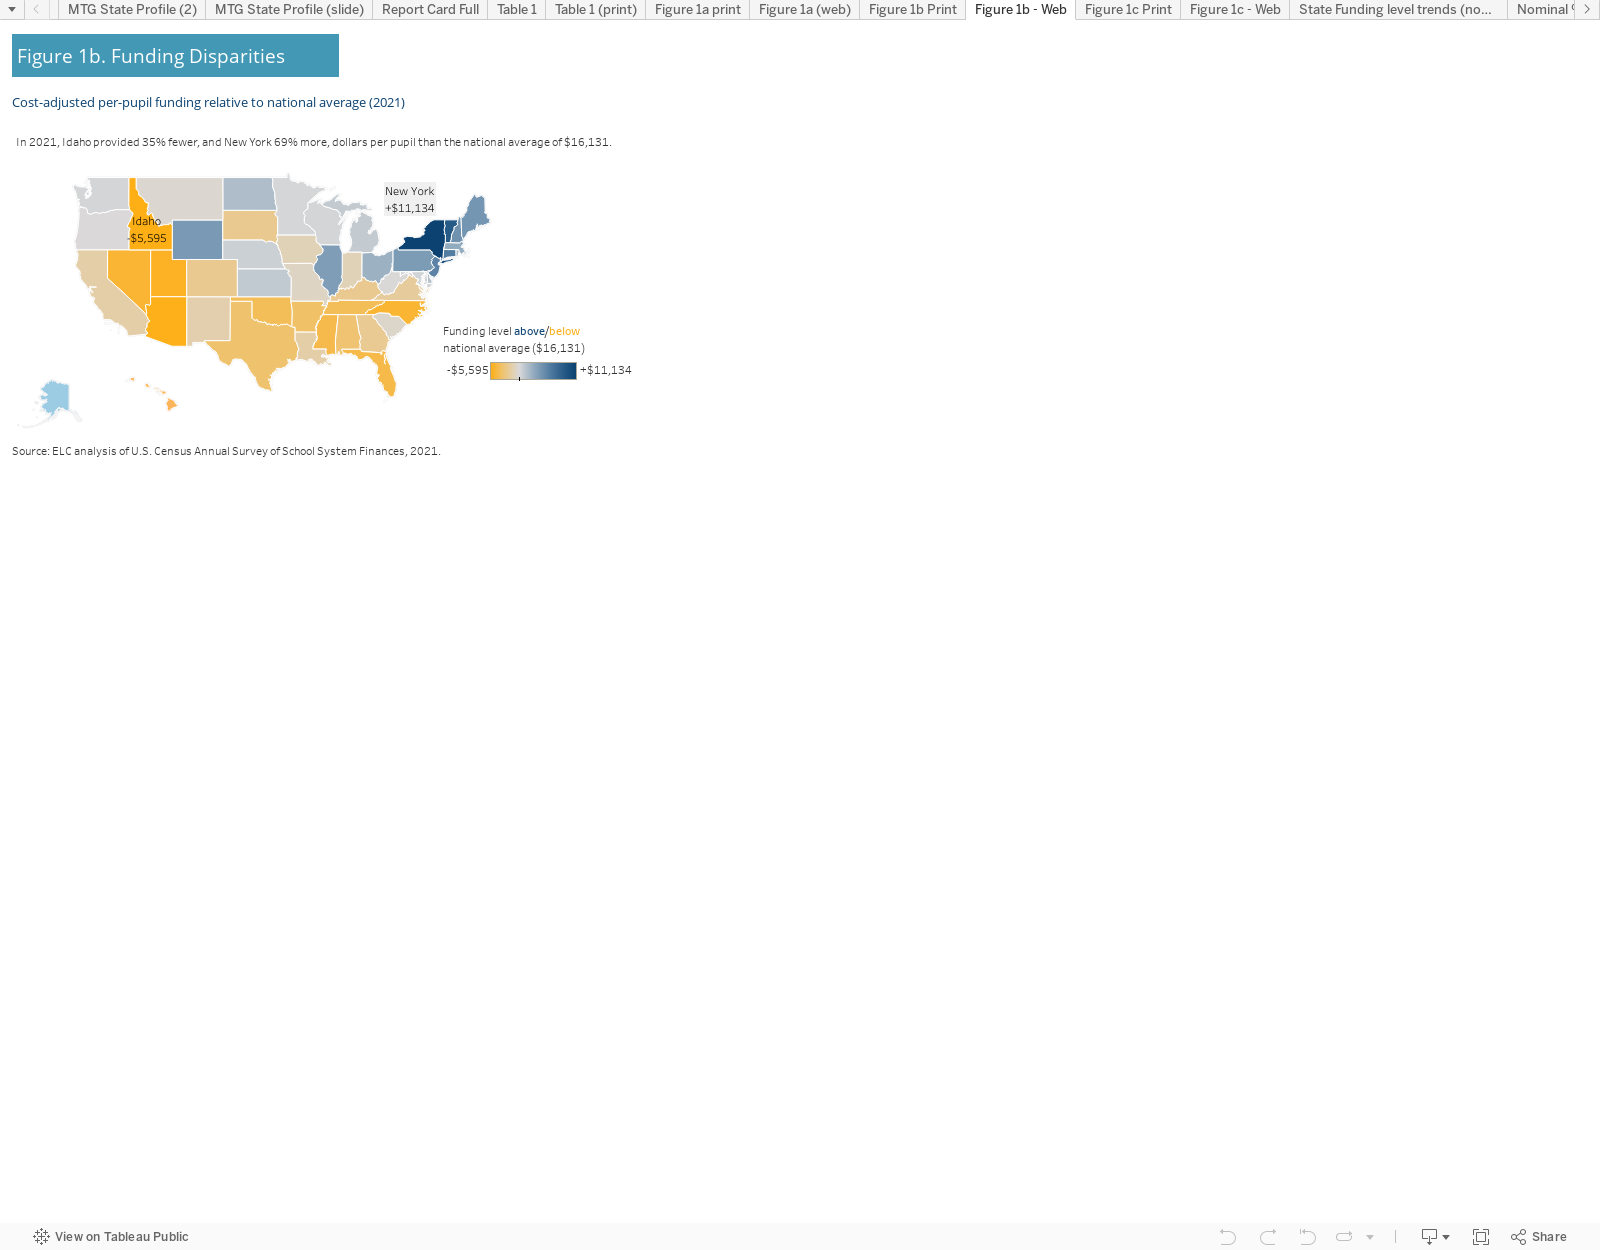
The pattern of school funding across the country remains familiar. Funding levels, even after adjusting for regional cost differences, vary widely (Figure 1a). The highest funded state, New York, provides over $11,000 more per pupil than the national average, and nearly $17,000 more per pupil than Idaho, the lowest funded state. There is a clear geographic pattern, with states in the South and the West providing far less funding than states in the Northeast and Midwest (Figure 1b).
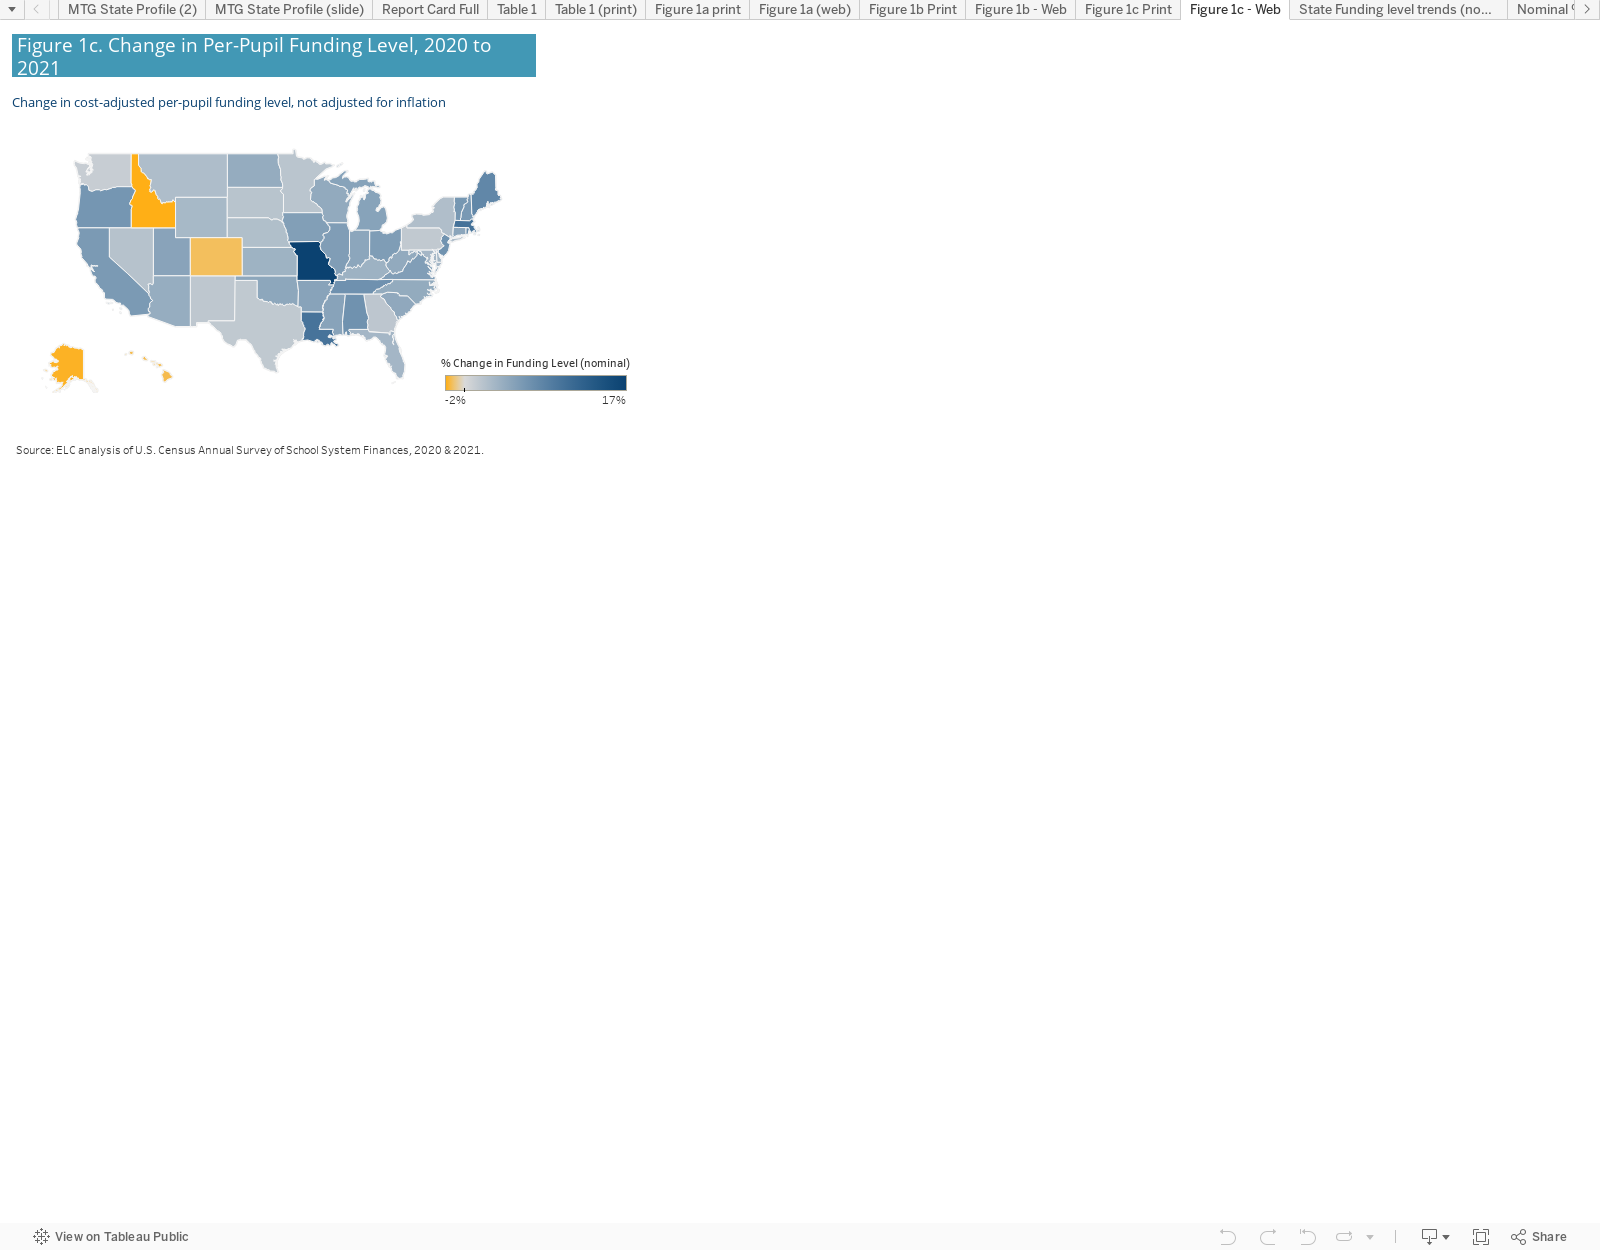
Funding Level One-Year Change
Considering nominal, non-inflation adjusted changes in state and local revenue relative to changes in enrollment, every state except four (Alaska, Colorado, Hawaii, and Idaho) reported greater per-pupil revenues than in 2020 (Figure 1c). However, in the 2020-2021 school year, the pandemic caused unusual shifts in the metrics used to examine funding levels. Below we examine three of those.
Enrollment
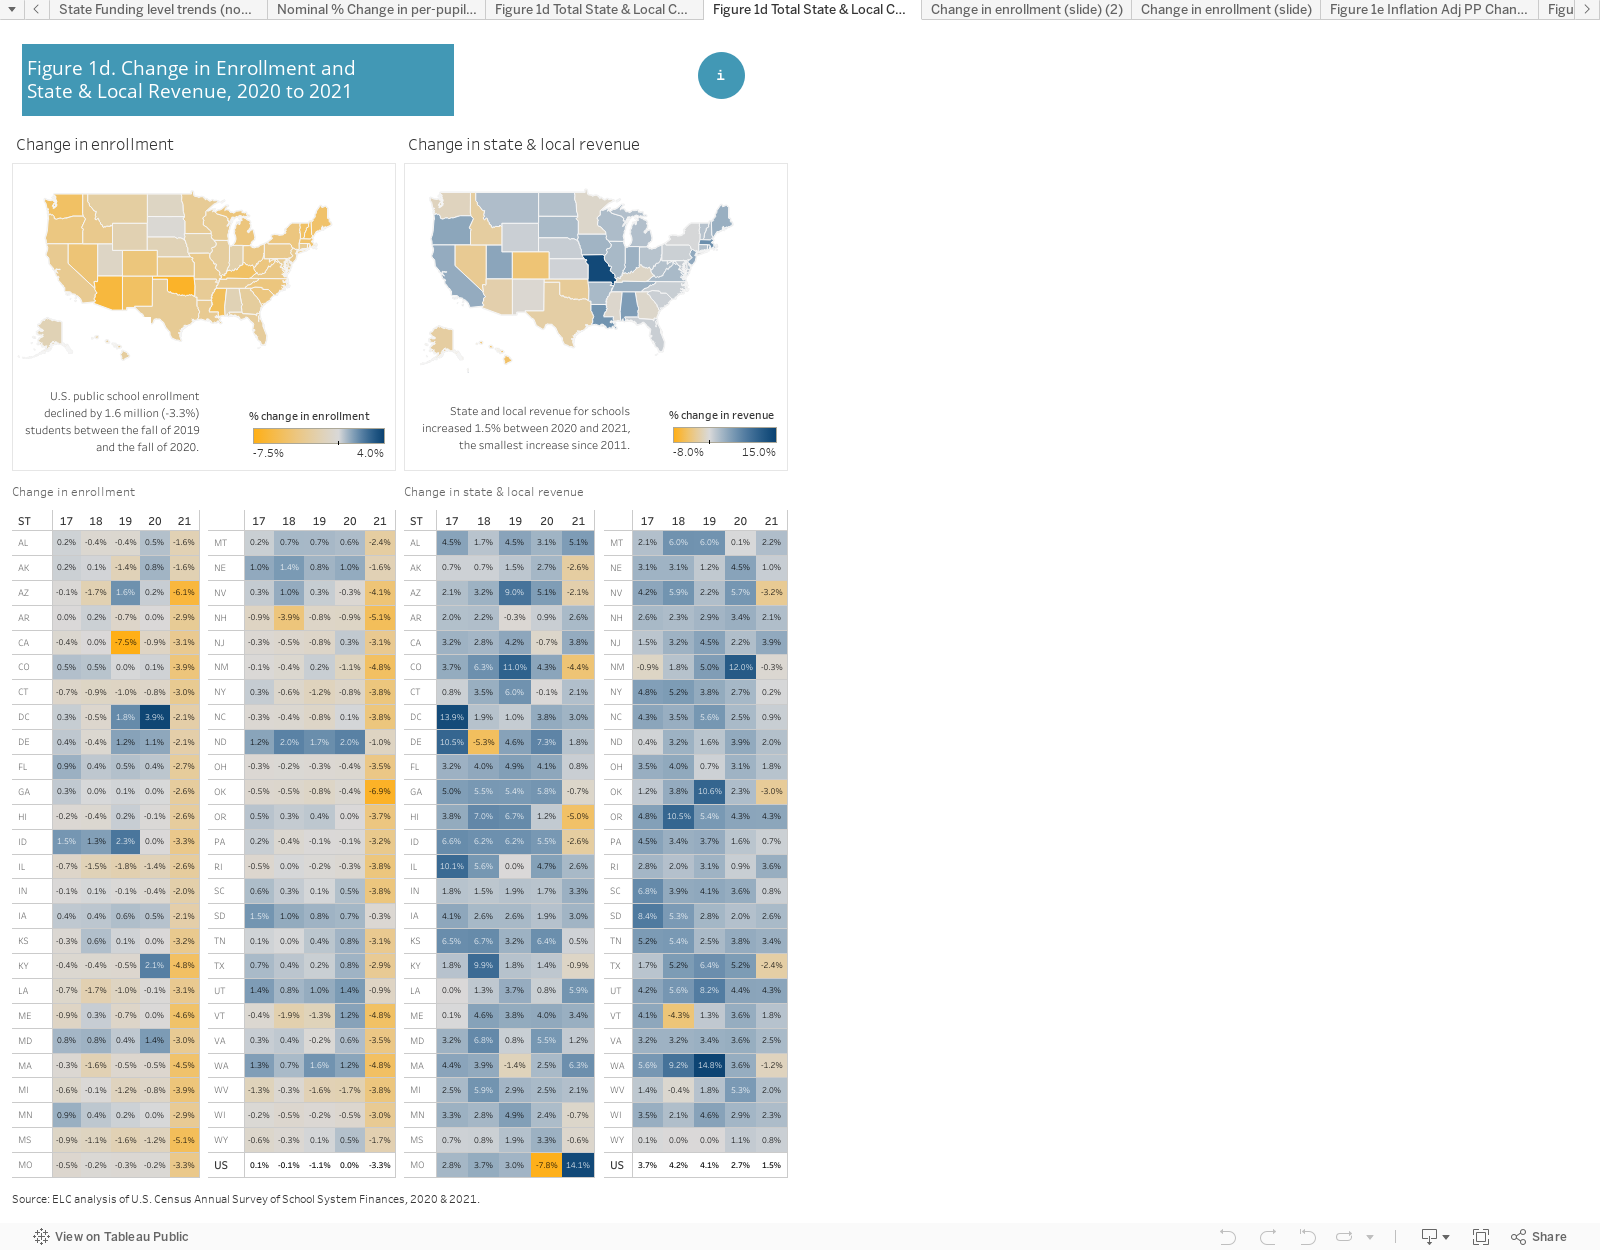
First, student enrollment declined precipitously: in fall 2020, there were 1.6 million fewer students enrolled in the nation’s public schools than the year prior, a 3.3% decline (Figure 1d). Every single state saw a decline in enrollment. In comparison, in fall 2019, only half of the states posted an enrollment loss, and overall enrollment was down only .01%. These enrollment losses likely did not affect funding allocations because state finance formulas typically use a prior year’s enrollment count to set aid levels and are not adjusted mid-year. Though this enrollment loss was provoked by Covid, it is unclear whether enrollment will rebound to pre-Covid levels as families return to public schools, or whether a significant number of families will continue in private or homeschooling settings.
This enrollment decline affects the funding level measure as states with significant enrollment loss have higher per-pupil funding levels, even without an increase on the revenue side.[10] Therefore, it is instructive to examine total state revenue next to enrollment data to better understand whether there was a disruption of expected trends in state and local support for public education (Figure 1d).[11]
Total Revenue
Figure 1d shows trends in nominal, not inflation-adjusted, state and local revenue. The nominal funding levels allow us to analyze the political decisions made around funding schools, i.e., whether states increased or decreased education funding relative to the previous year. In 2021, 14 states reduced total state and local funding for PK-12 education, the largest disinvestment since the 2008 Recession-era cuts. The five-year trends in Figure 1d clearly show that most states increased state and local revenue each year, a pattern that is clearly disrupted in 2021. Hawaii saw the largest decrease, at nearly 5%, with much of that coming from a reduction in general formula assistance. Colorado saw the second largest cut with a 4.4% reduction, including a 9% decrease in general formula support and a pause in the state’s contribution to the public employee pension program. Nationally, total state and local revenue for education increased by only 1.5%, compared to 2.7% in 2020, and even higher in years prior.
We can use the example of Oklahoma to show how unusual changes in enrollment and total revenue interact to affect per-pupil funding levels. Oklahoma had the largest decline in enrollment and also had a significant reduction in total state and local revenue. If enrollment had been stable, per-pupil funding levels would have declined relative to 2020. But instead, because of the extent of enrollment loss, per-pupil funding increased. Importantly, this uptick does not reflect an increased commitment to education but in fact the opposite.
These trends clearly show a significant reduction in state and local support for education and demonstrate the precarious relationship between economic expectations and school funding. Many states reduced or slowed investments in public education in response to dire, yet ultimately incorrect, economic forecasts. These decisions were also made well before policymakers knew how much federal support would eventually flow to school districts to address pandemic needs. Policymakers could not know the extent or duration of the Covid-19 disruptions and their ultimate impact on the academic and social and emotional health of students. But it is clear that education budgets suffer when confidence in the economy falters.
Inflation
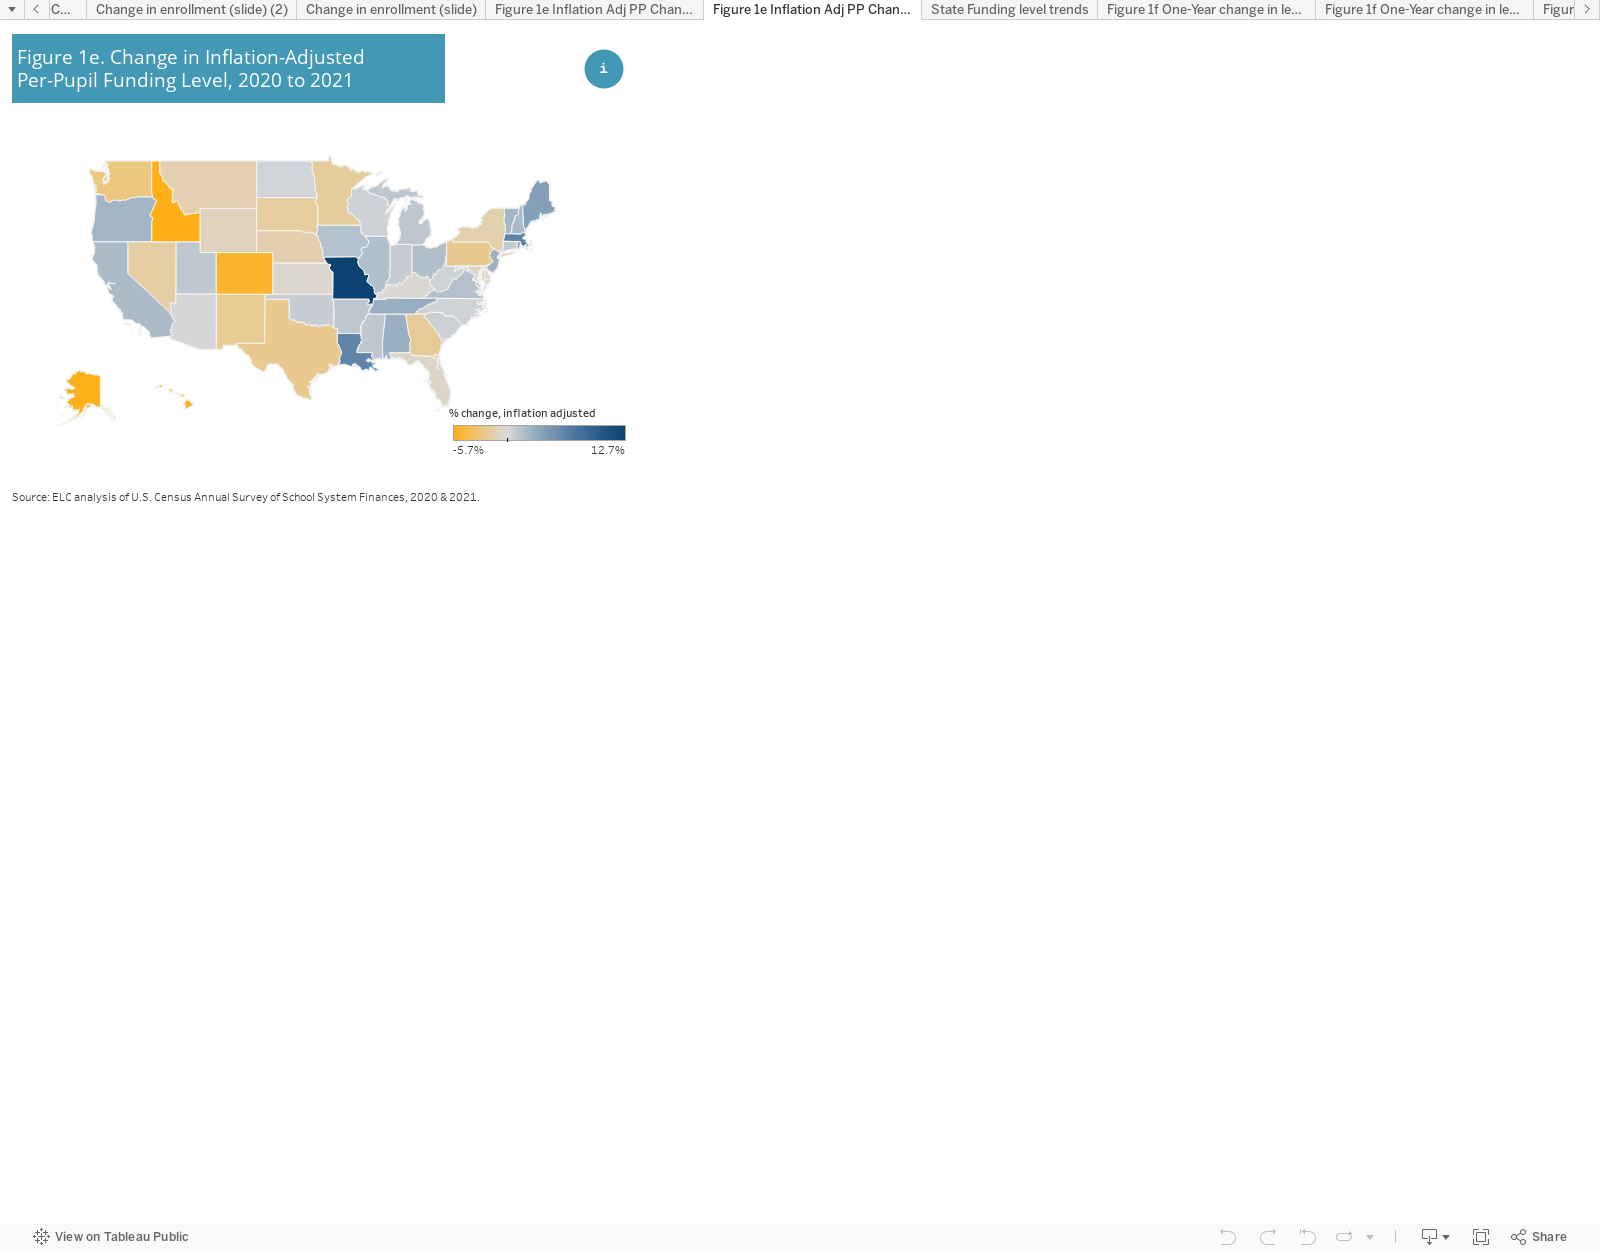
A third factor that affects one-year changes in funding level is inflation. Even districts with the same levels of funding would have had less purchasing power in 2021 because of the extremely high inflation rate. Inflation affects school districts in myriad ways – from the increasing cost of supplies and transportation to the rising costs of benefits for staff.[12]
When we consider changes in per-pupil funding while adjusting for inflation (and regional wage variation), we find that more than a third of states had reduced funding levels compared to 2020 (Figure 1e). In contrast to Figure 1c, where nearly all states saw nominal per-pupil funding increase, Figure 1e shows that, after adjusting for inflation, 21 states saw funding decline. Many of the states that saw inflation-adjusted per-pupil revenue losses were already among the lowest funded states in the country: Colorado, Georgia, Hawaii, Idaho, Nevada, New Mexico, and Texas.
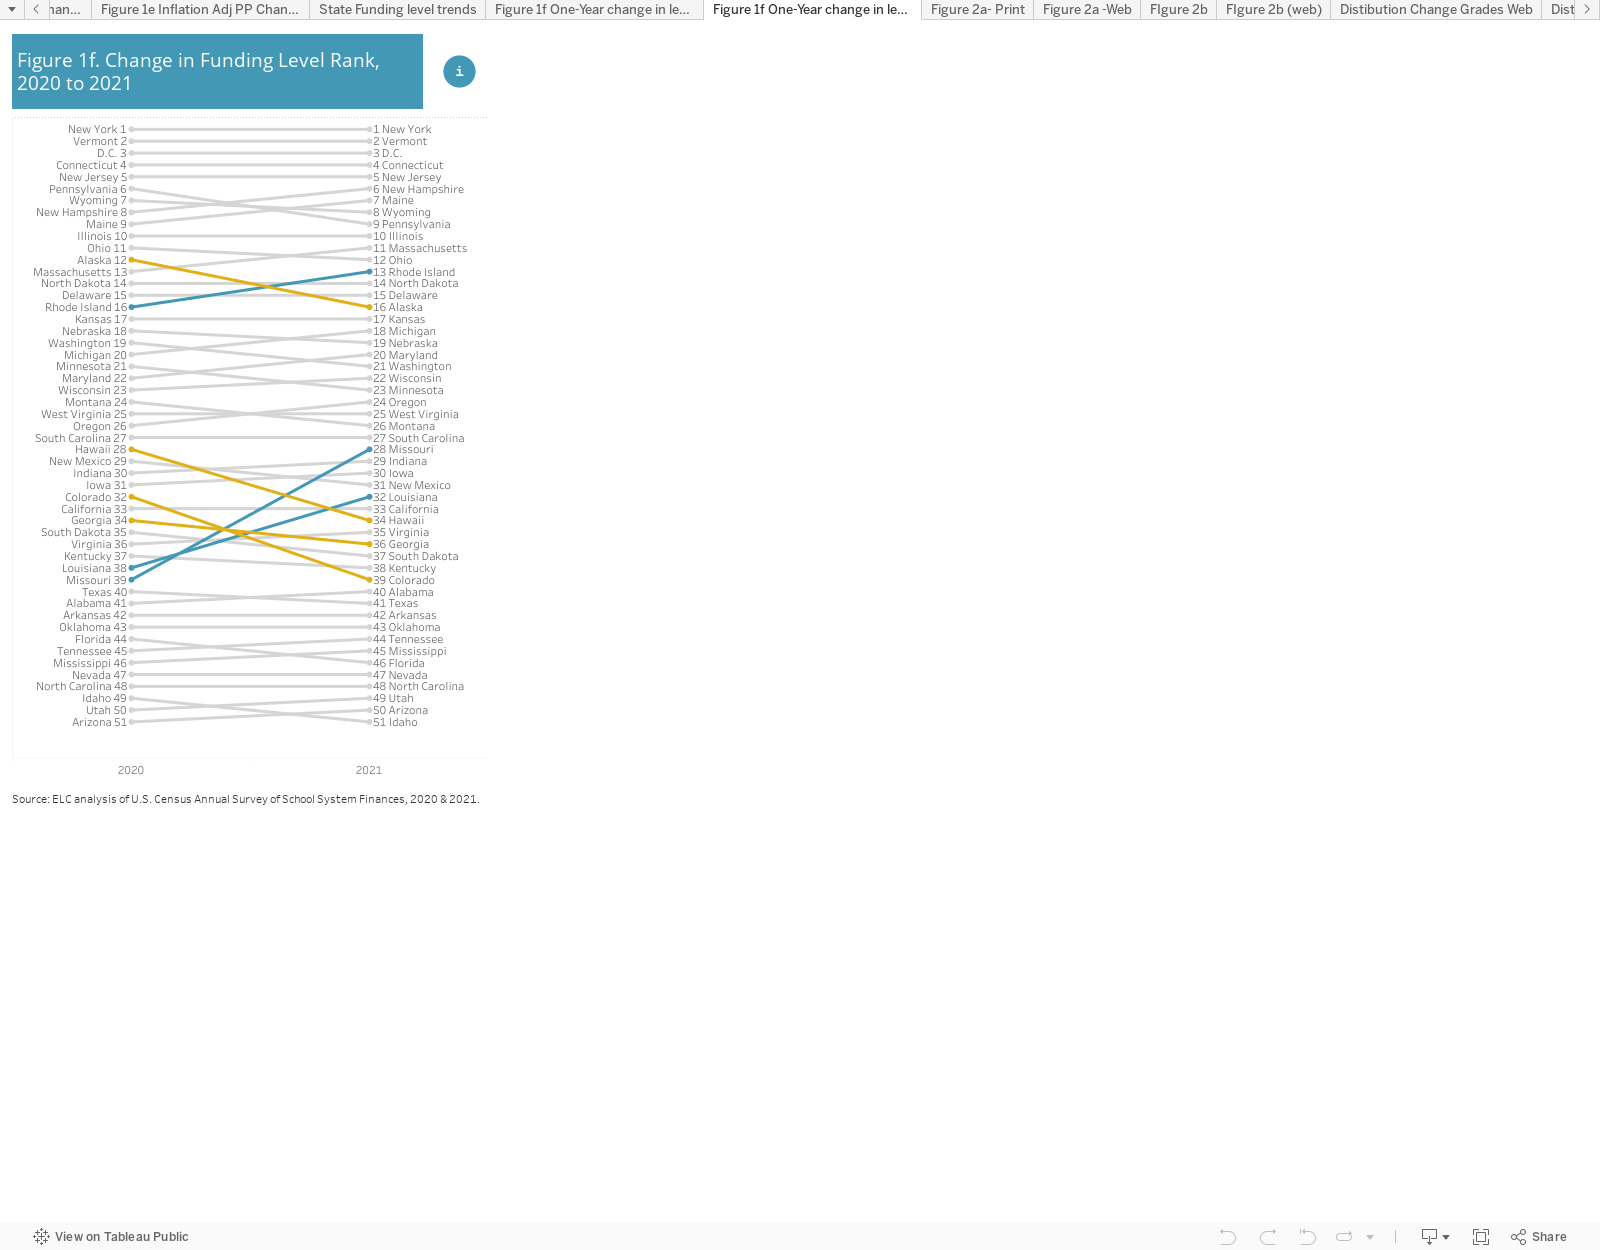
Despite the influence of enrollment declines, reduced state and local support, and inflation, relative per-pupil funding levels among states remained surprisingly stable (Figure 1f). Most states did not move more than two positions in either direction in terms of funding level rank. Exceptions are Missouri (+11), Louisiana (+6), and Rhode Island (+3), which climbed in rank relative to other states. In Missouri and Louisiana, the driving factor in their improvement was a substantial increase in local funding. On the other extreme, Georgia (-3), Alaska (-4), Hawaii (-6), and Colorado (-7) lost ground compared to other states.
Funding Distribution
The hallmark of a fair and equitable school finance system is that it delivers more funding to educate students in high-poverty districts.[13] This means states providing equal or less funding to high-poverty districts are shortchanging the students most in need of additional resources for academic success.
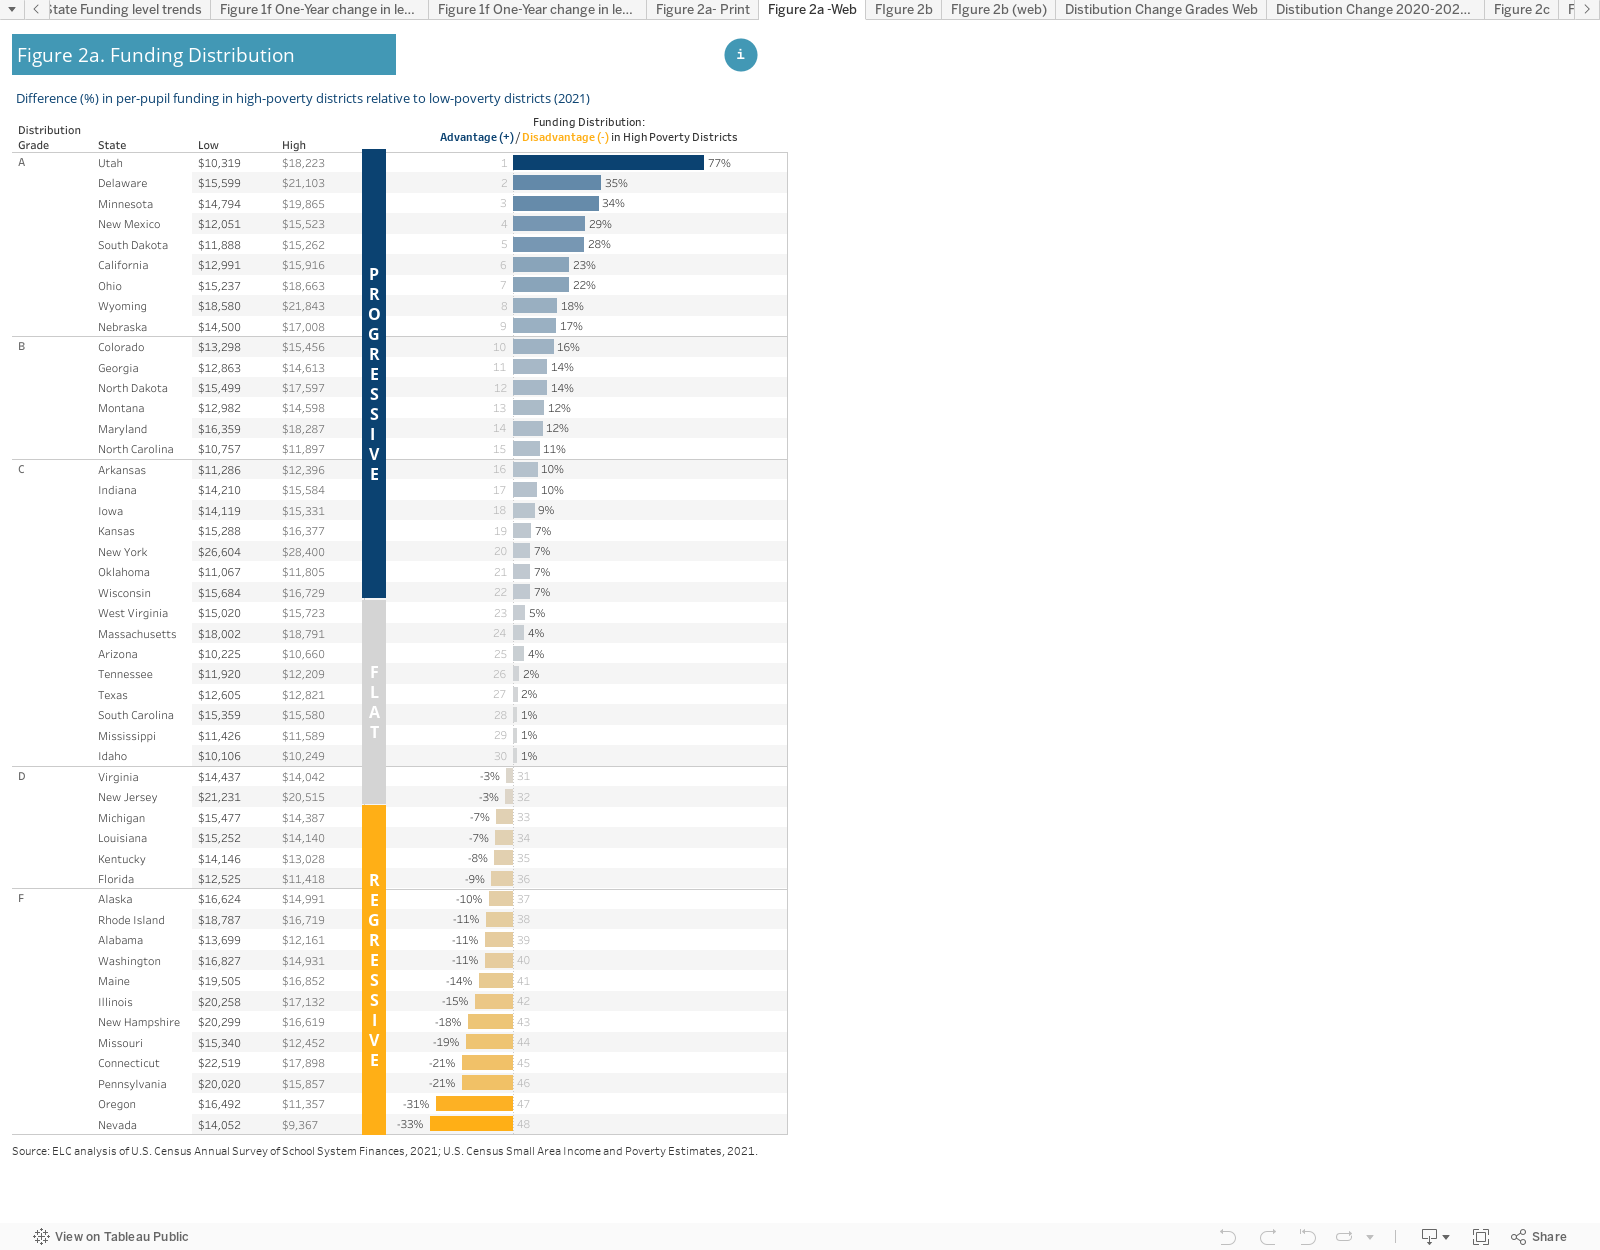
Figure 2a depicts funding distribution in each state by comparing the average per-pupil funding allocated to high-poverty districts to that allocated to low-poverty districts. States providing more per-pupil funds to high-poverty districts have a “progressive” distribution system, resulting in a higher grade on the funding distribution measure. States that do the opposite have a “regressive” distribution system and earn a lower grade. States with similar funding levels in high- and low-poverty districts have “flat” distribution systems.
There is wide variation in the manner in which states distribute funding to districts. Some states have a markedly progressive distribution of funding. Utah, Delaware, and Minnesota provide high-poverty districts with at least 30% more per-pupil funding than low-poverty districts, on average. On the other hand, Oregon and Nevada have deeply regressive funding systems, with high-poverty districts receiving at least 30% less funding than low-poverty districts.
Only 22 states have even modestly progressive school funding systems with at least 5% more funding, on average, in high-poverty districts. School funding is flat (+/-5%) in 10 states, meaning there is no appreciable increase in funding to address the need for additional resources in high-poverty districts. The remaining 16 states have regressive funding systems, i.e., they provide less funding to their poorest districts.
Funding Distribution One-Year Change
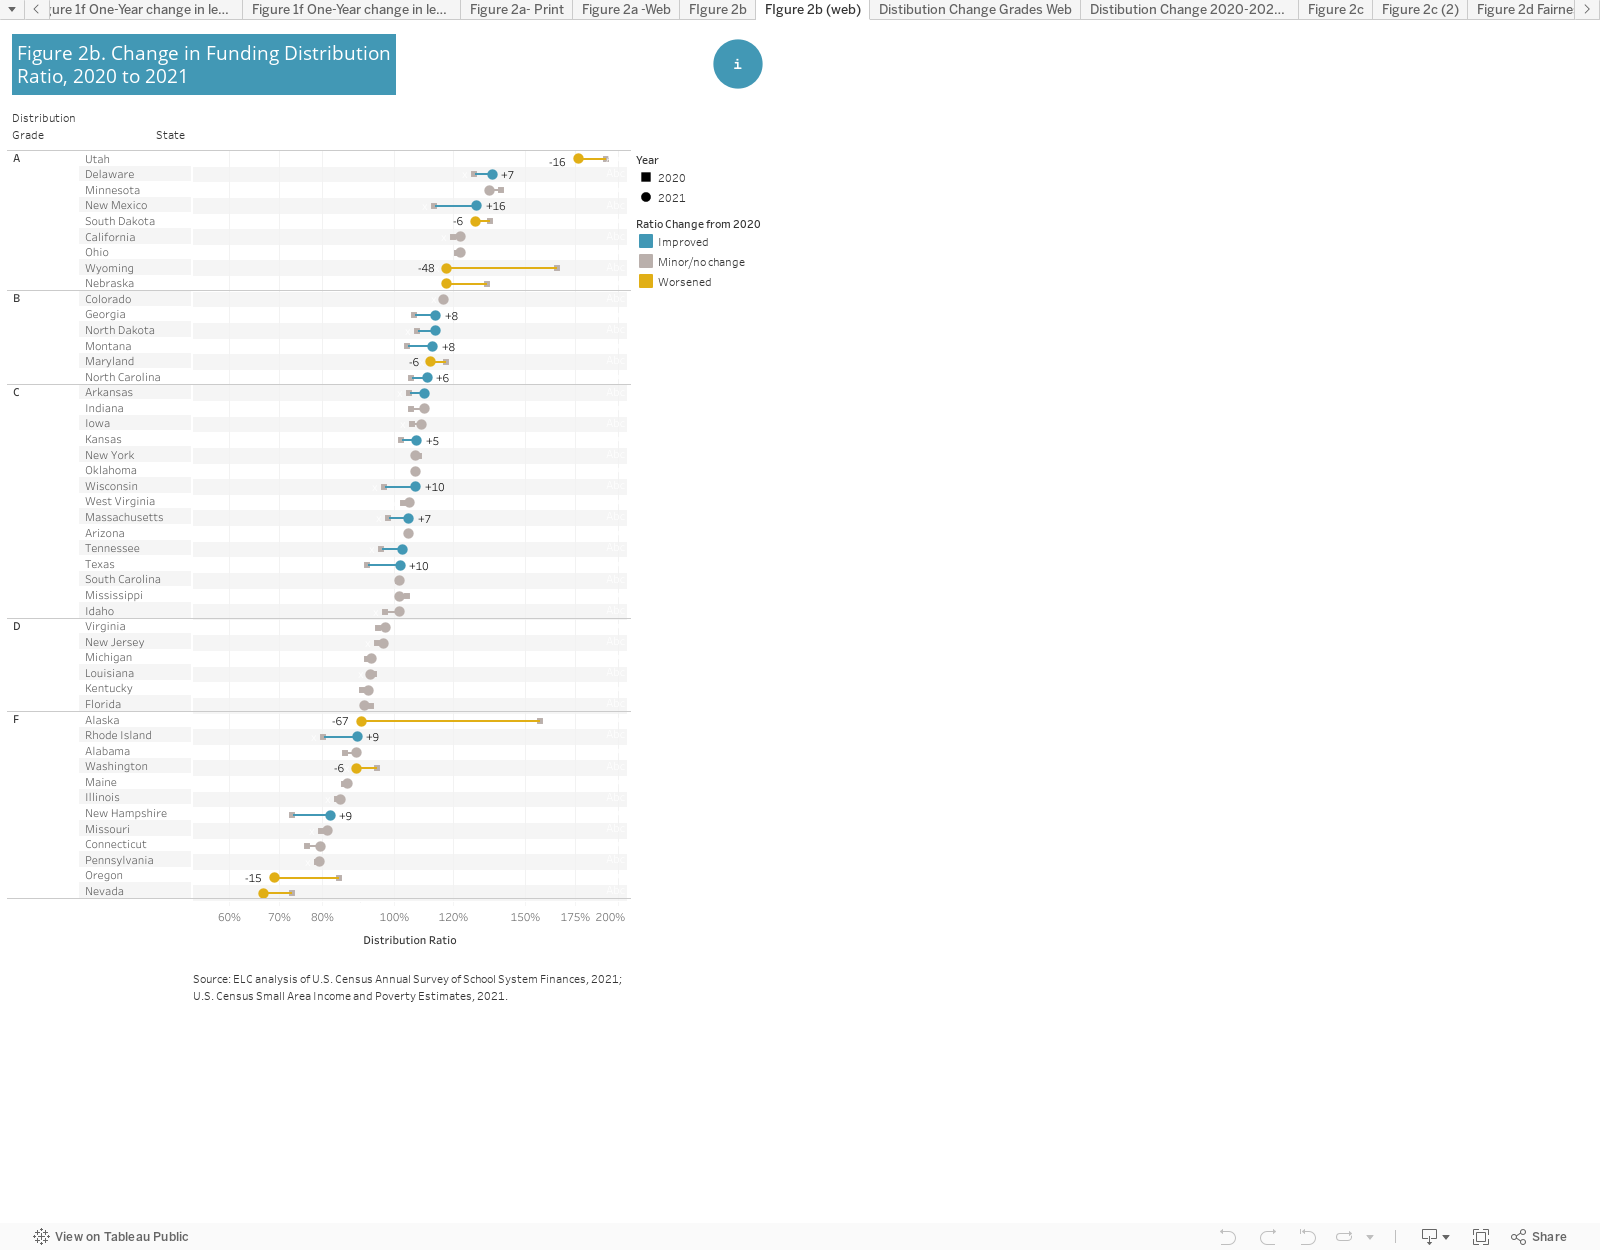
When examining changes in funding distribution between 2020 and 2021, we see some areas of progress but also causes for concern (Figure 2b). More than half of the states improved funding distribution between 2020 and 2021, though the changes were mostly modest. Of the 32 states that saw their distribution ratio increase, 18 saw increases of less than 5 percentage points. The most significant improvements were in New Mexico (+16), Wisconsin (+10), Texas (+10), New Hampshire (+9), and Rhode Island (+9). Fewer states saw funding distribution worsen, though many that did saw more significant shifts. Alaska, Nebraska, Oregon, Utah, and Wyoming saw their distribution ratios decline by more than 15 points. Utah, Wyoming, and Alaska had a historically progressive distribution of funds, but saw significant one-year losses. Oregon and Nevada were already among the most regressive states and saw their funding distribution ratios plunge further.
When examining changes in funding distribution between 2020 and 2021, we see some areas of progress but also causes for concern (Figure 2b). More than half of the states improved funding distribution between 2020 and 2021, though the changes were mostly modest. Of the 32 states that saw their distribution ratio increase, 18 saw increases of less than 5 percentage points. The most significant improvements were in New Mexico (+16), Wisconsin (+10), Texas (+10), New Hampshire (+9), and Rhode Island (+9). Fewer states saw funding distribution worsen, though many that did saw more significant shifts. Alaska, Nebraska, Oregon, Utah, and Wyoming saw their distribution ratios decline by more than 15 points. Utah, Wyoming, and Alaska had a historically progressive distribution of funds, but saw significant one-year losses. Oregon and Nevada were already among the most regressive states and saw their funding distribution ratios plunge further.
It is worth noting that the factors driving these changes differ by state (Figure 2c). In New Mexico, the state’s already progressive distribution improved because of a slight increase in average funding among the highest poverty districts along with an even greater decline in average funding among the lowest poverty districts. The same is true in Texas, though the changes were smaller. Rhode Island, a state with a regressive funding distribution, increased funding among all districts, but the gains were largest among high-poverty districts, leading to greater progressivity. In all states where the funding ratio worsened, the change was caused by a decline in the average per-pupil funding levels of the highest poverty districts, while average funding in low-poverty districts either increased or stayed the same.
The impact of Covid-related funding decisions on changes in distribution does not follow a clear pattern. For example, Idaho, New Mexico, and Texas improved their funding distribution while cutting state and local revenue. But Louisiana, Missouri, and West Virginia significantly increased total state and local funding with little impact on distribution. Alaska and Wyoming both became significantly less progressive, though Wyoming saw a modest increase in state and local revenue while Alaska made one of the larger revenue cuts. The multiple moving parts that influence funding distribution patterns underscore the complexity of school finance in the states and the need for policymakers to make informed decisions about the impact of annual changes in public school support.
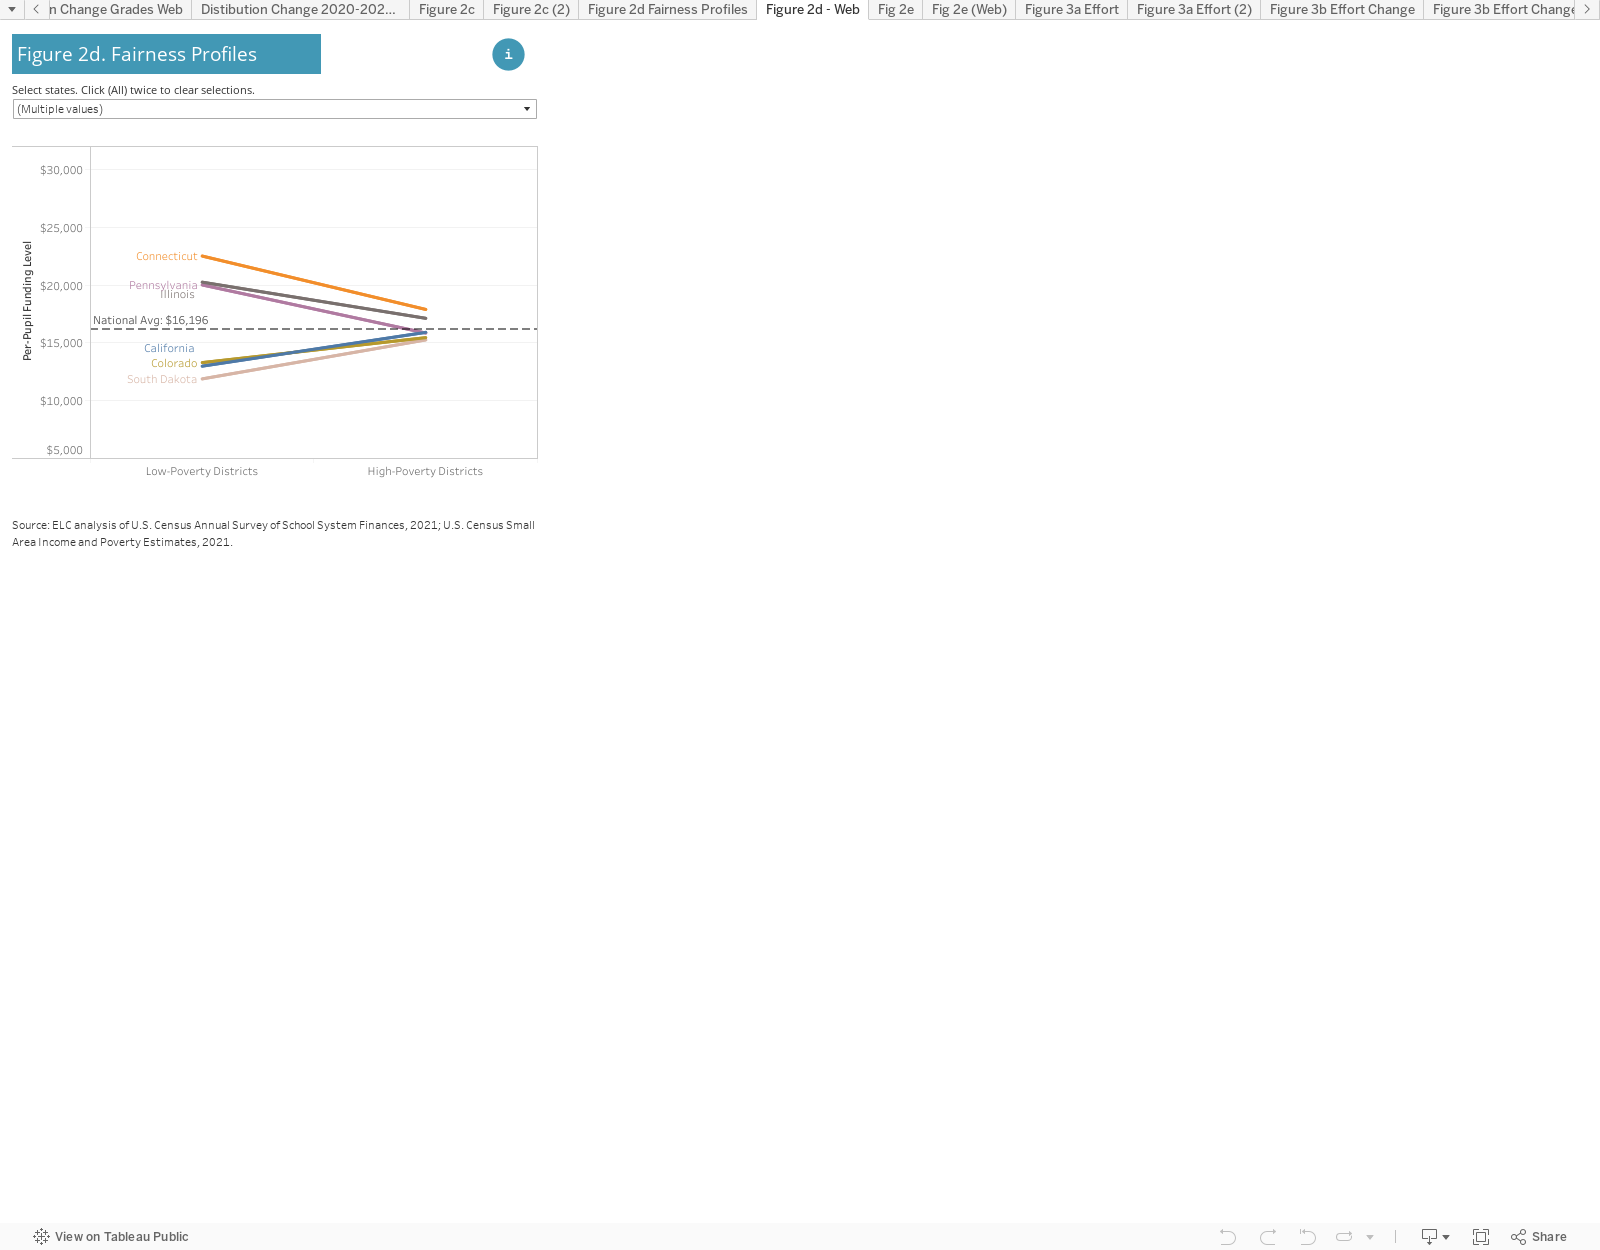
Fairness Profiles
The fairness of a state’s school funding system is contingent on both adequate funding levels and a progressive distribution of funds. Some seemingly well-resourced states, such as Illinois, Connecticut, and Pennsylvania, do a poor job of targeting those funds where they are most needed, leaving large disparities in average funding levels of the highest and lowest poverty districts. Likewise, some states with a progressive distribution, such as South Dakota, California, and Colorado, have low overall funding levels that leave even their highest poverty districts with funding that just barely reaches the national average (Fig. 2).
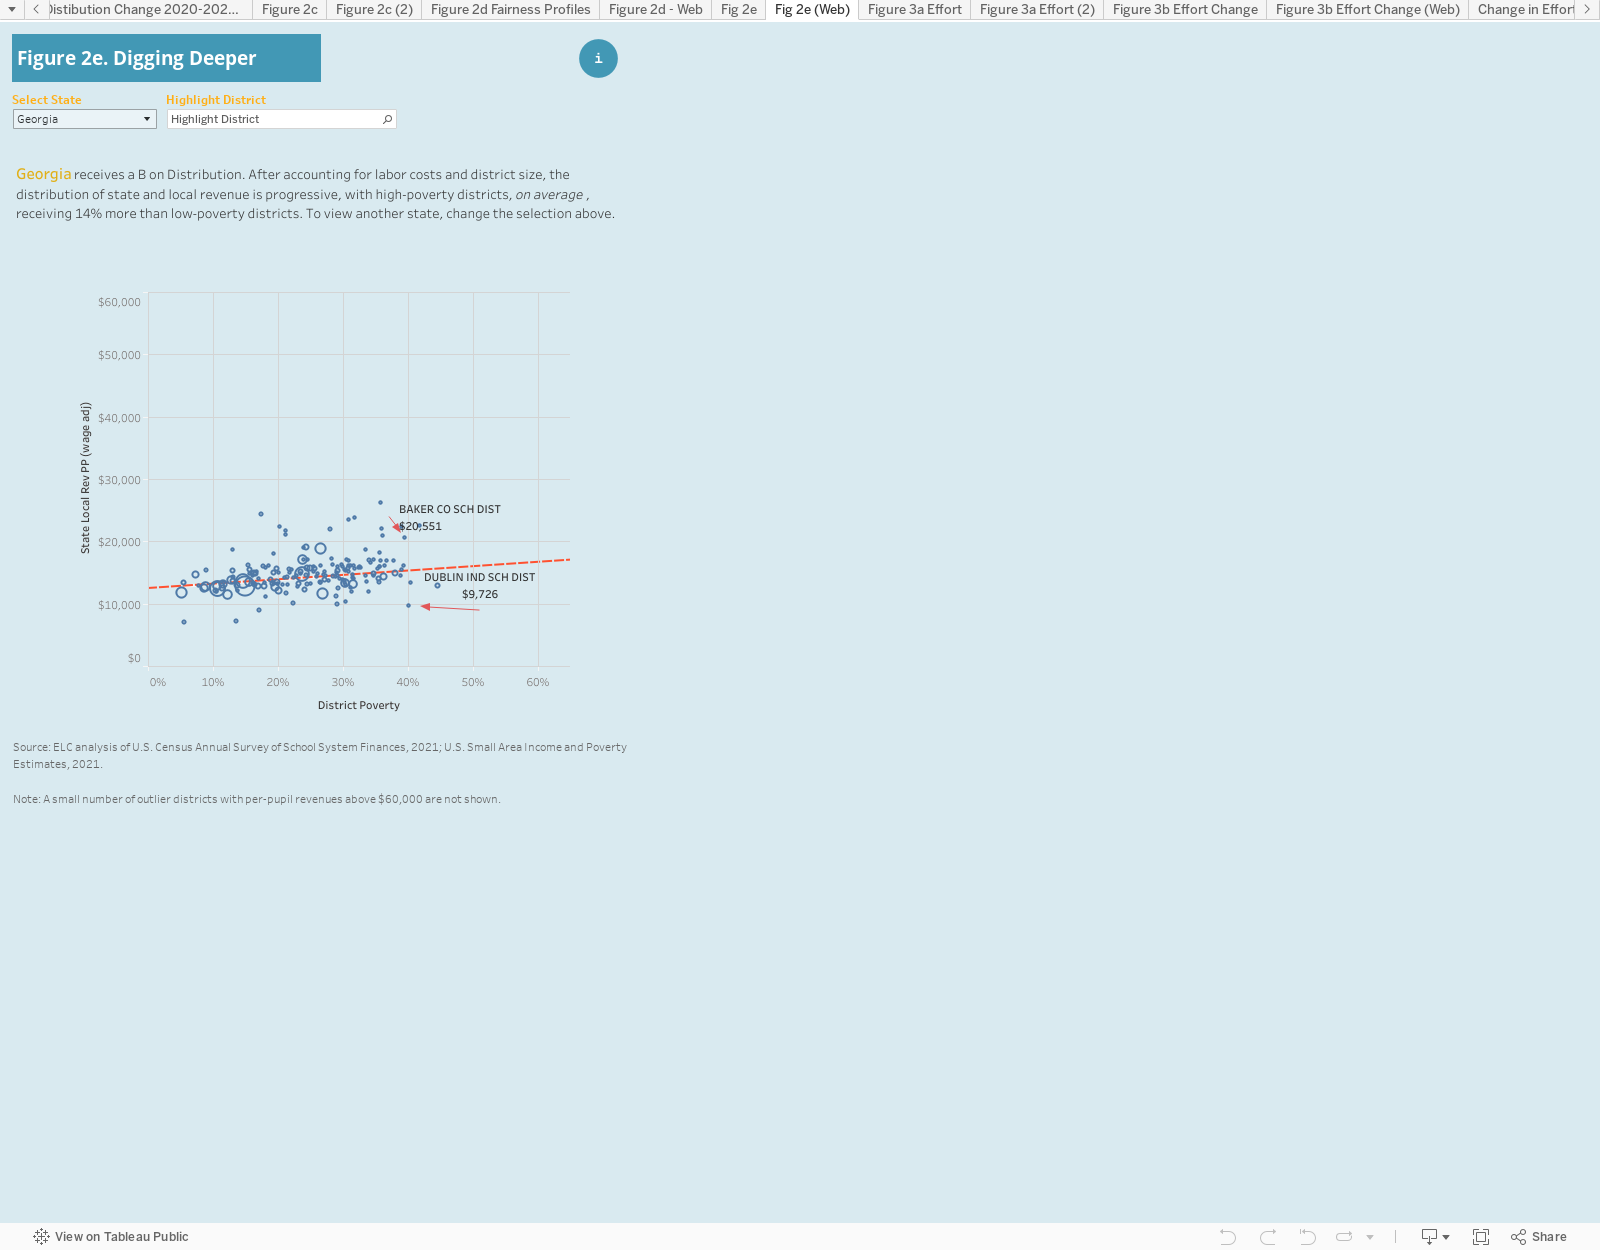
The funding distribution measure uses district-level data to determine a state’s overall pattern of school funding. It is important to recognize that this measure may not capture the variations in a complex system. There will inevitably be individual districts that do not match the statewide pattern presented here. Figure 2e shows how funding levels in Georgia, adjusted for regional cost differences, sometimes diverge from the overall statewide pattern depicted in the funding distribution measure. For example, Baker County and Dublin Independent school districts both have 40% poverty rates, but the former received over $20,000 per pupil while the latter received less than $10,000. Some of this difference may be related to district size or other cost-drivers, but the difference could also reflect inconsistencies in how funding is distributed relative to poverty.
There is no substitute for more detailed analysis of the conditions in states that influence the distribution of funding. Such an analysis is beyond the scope of this report, but the findings presented here can serve as a starting point for deeper research and discussion of the need for finance reform. See examples of our state-specific work here.
Funding Effort
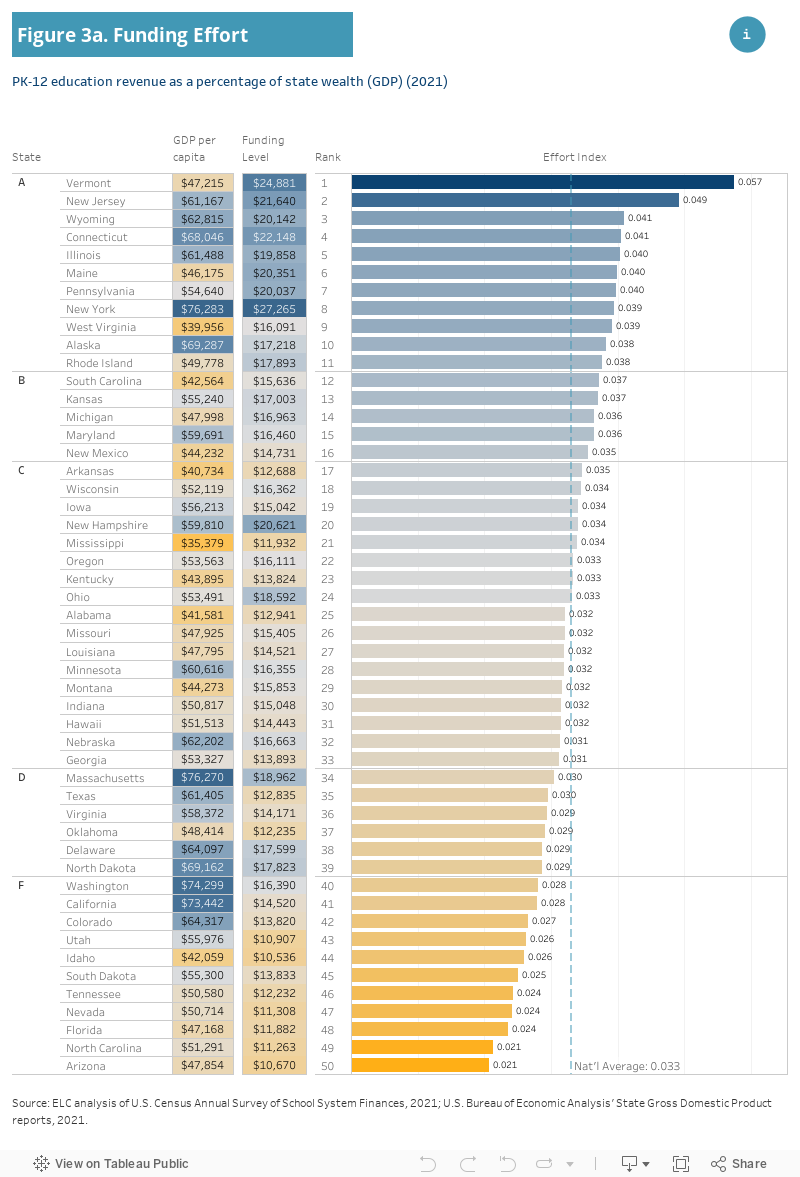
Figure 3a ranks states on effort measured as PK-12 revenue as a percentage of the state’s economic activity, or gross domestic product (GDP).[14] It is important to evaluate a state’s effort index in the broader context of overall economic wealth. Consider New York and West Virginia: both states receive an A for well above average effort, but one state is relatively wealthy with a high per-capita GDP, and the other is relatively poor. Though they are making a similar effort to fund schools, New York is able to generate much higher per-pupil funding levels than West Virginia. Figure 3a juxtaposes a state’s effort compared to the national average with its per-capita GDP and per-pupil funding levels to contextualize how the effort index interacts with the state’s relative wealth to produce high or low funding levels.
It is also important to recognize that the effort index reflects both state and local funding as a percentage of GDP at the state level. A high effort index does not mean funding is distributed equitably across districts within the state. In fact, many of the highest effort states receive an A on funding level and an F on funding distribution (Connecticut, Illinois, Maine, and Pennsylvania). In these states, the high funding levels, driven by local property taxes, are disproportionately concentrated in the state’s lowest poverty districts, while the highest poverty districts are left with less.
Funding Effort One-Year Change
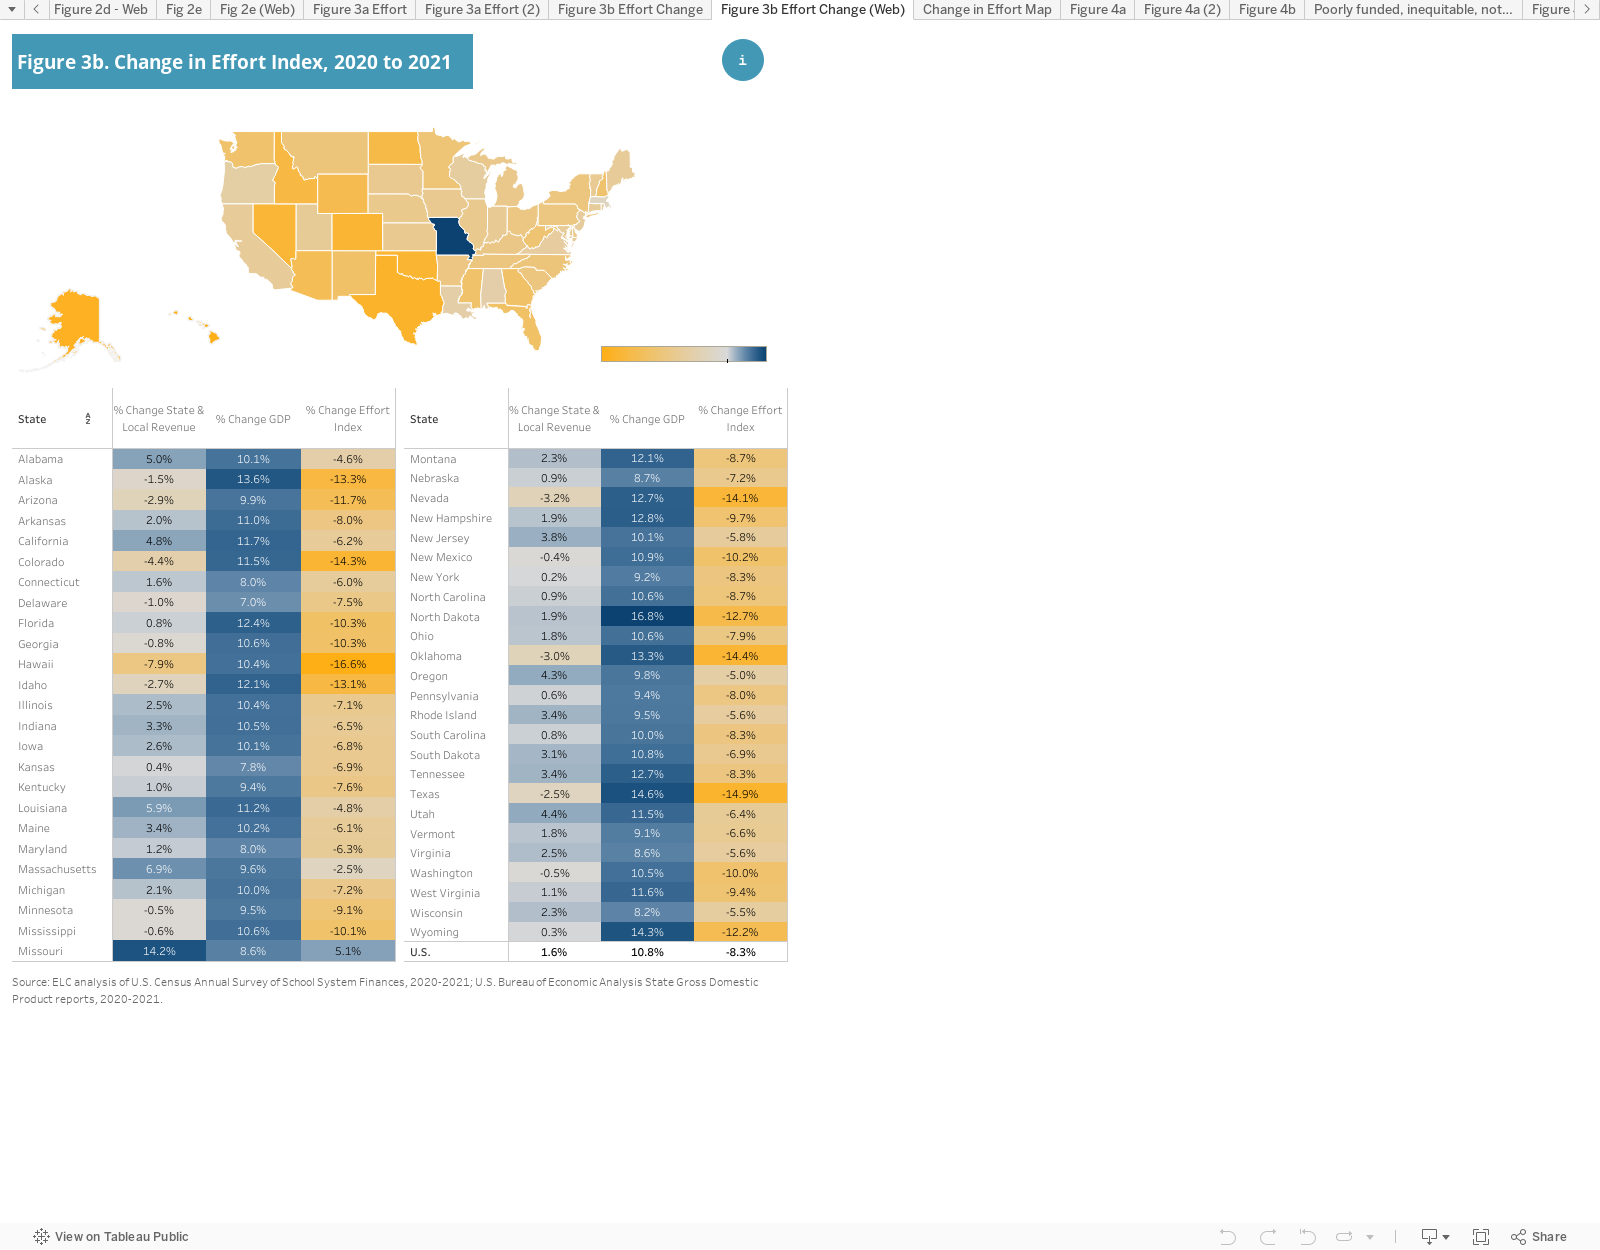
The one-year change in the effort index further underscores how unrealized fears about economic prospects during the early days of the pandemic may have influenced school funding decisions. We demonstrated previously that many states reduced state and local funding for education in response to the uncertain economic outlook. The first column of data in Figure 3b highlights states that reduced state and local revenue. And yet, when we examine the change in nominal GDP (the second column), we find that all states saw substantial gains in economic activity, with most states experiencing double digit growth (not inflation adjusted). Nationally, GDP grew by more than 10% in 2021, much larger than recent trends where growth ranged between 3 and 5%. The combination of slower than typical growth in PK-12 revenue with faster than typical growth in GDP resulted in a near universal decline in the effort index across states. Only in Missouri did school funding keep pace with economic growth. On the other hand, Texas, Alaska, Oklahoma, and Nevada were all in the top quarter of states for economic growth but had among the largest reductions in state and local revenue for education.
Because the economic growth happened after states set their budgets for the 2021 fiscal year and was in the opposite direction from what was expected, the decline in effort is not surprising. Unfortunately, funding trends after the Great Recession showed how long it can take for school funding to rebound once funding cuts have been made, even after the economic picture has returned to normal.[15] We already see evidence of this pattern emerging after the pandemic. According to the Center on Budget and Policy Priorities, at least 14 states that built up temporary surpluses through a healthy economy and the cushion of federal funding from Covid relief pushed through permanent tax cuts. Instead, states could have used those funds to make long-overdue investments in public education and other services.[16] This represents a squandered opportunity to leverage economic growth to improve public schools.
Putting It All Together
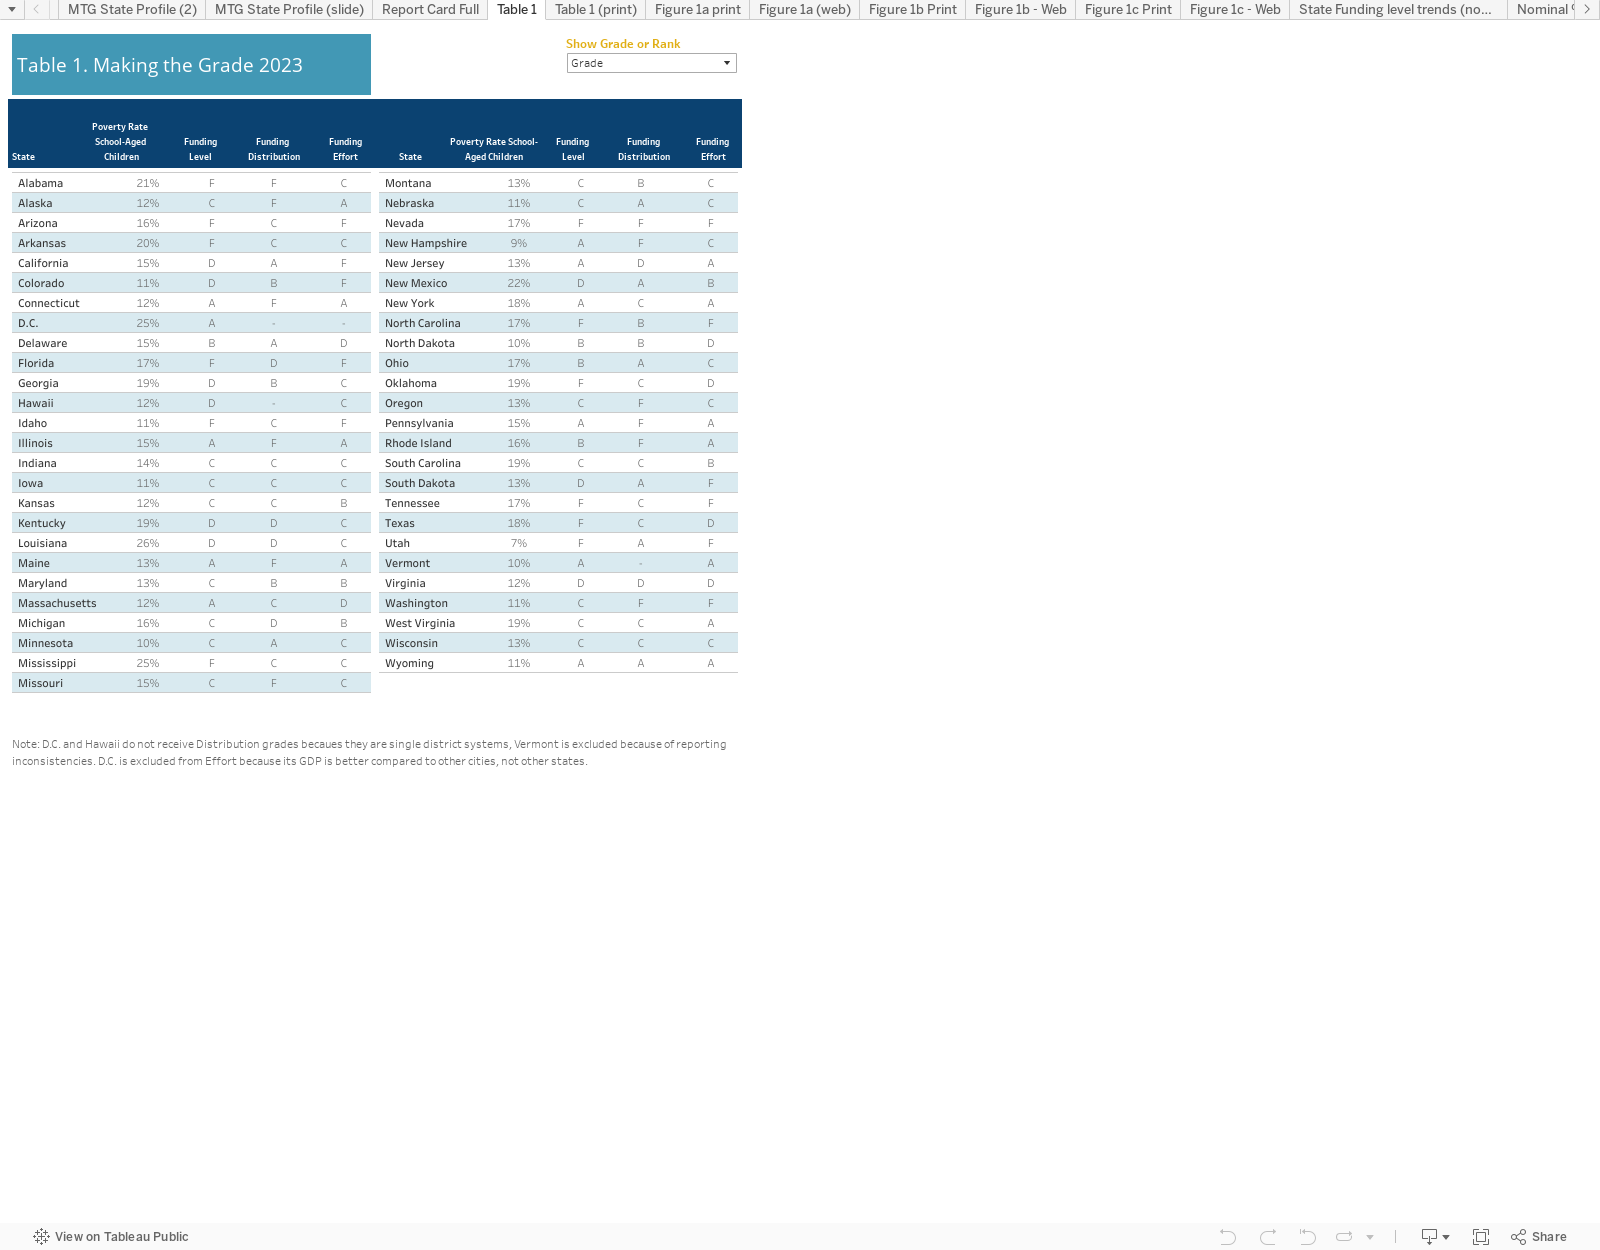
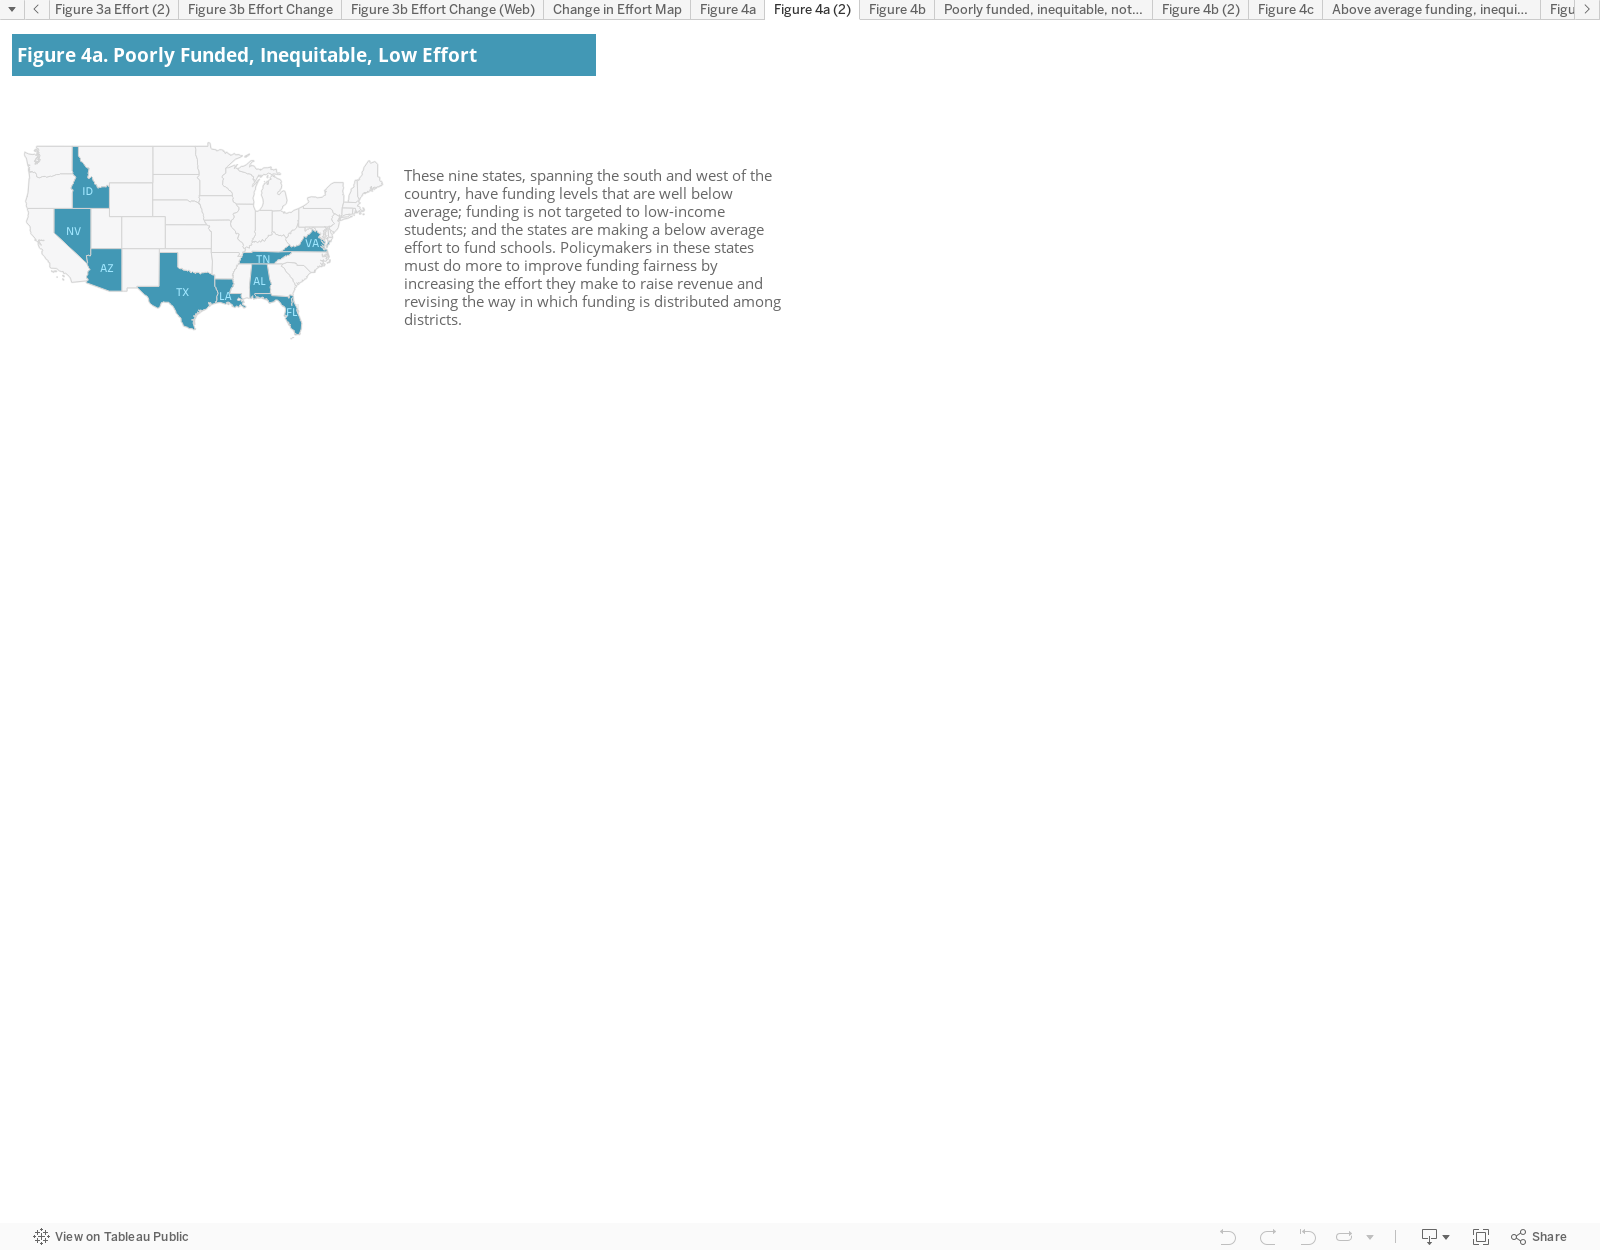
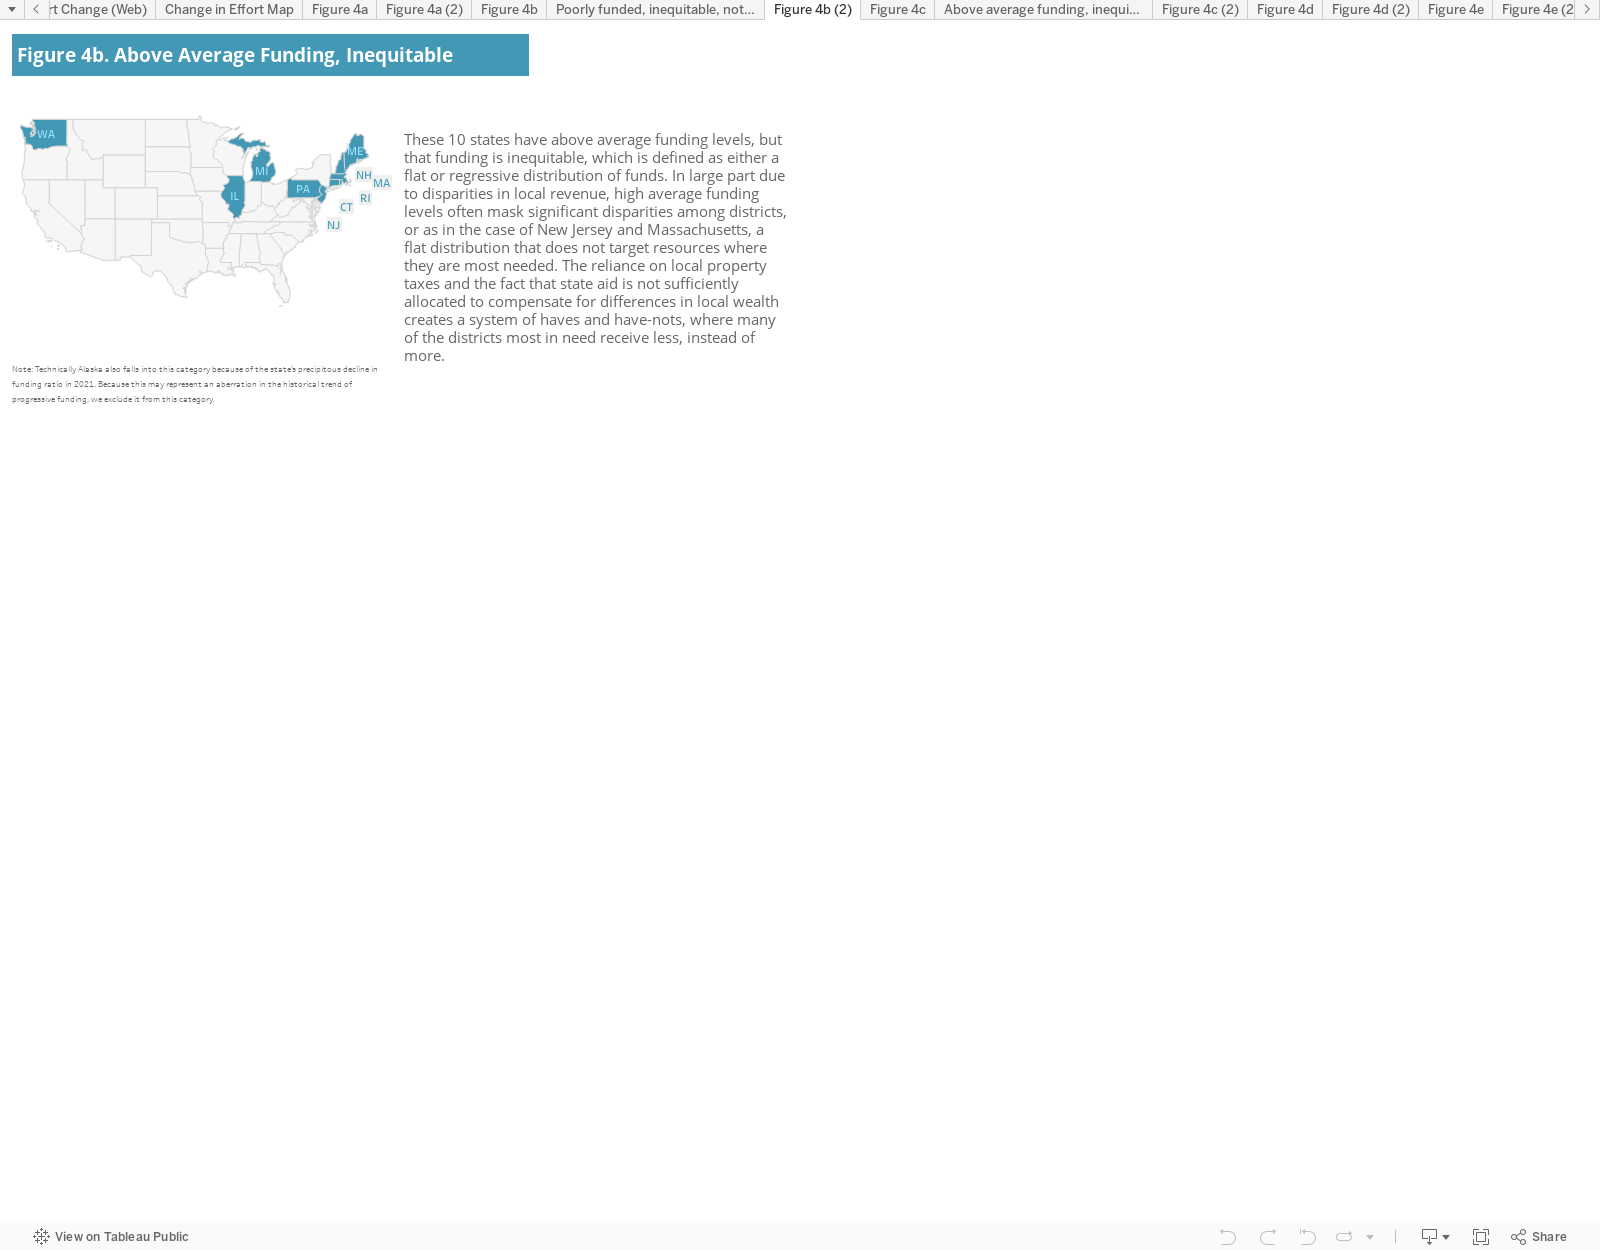
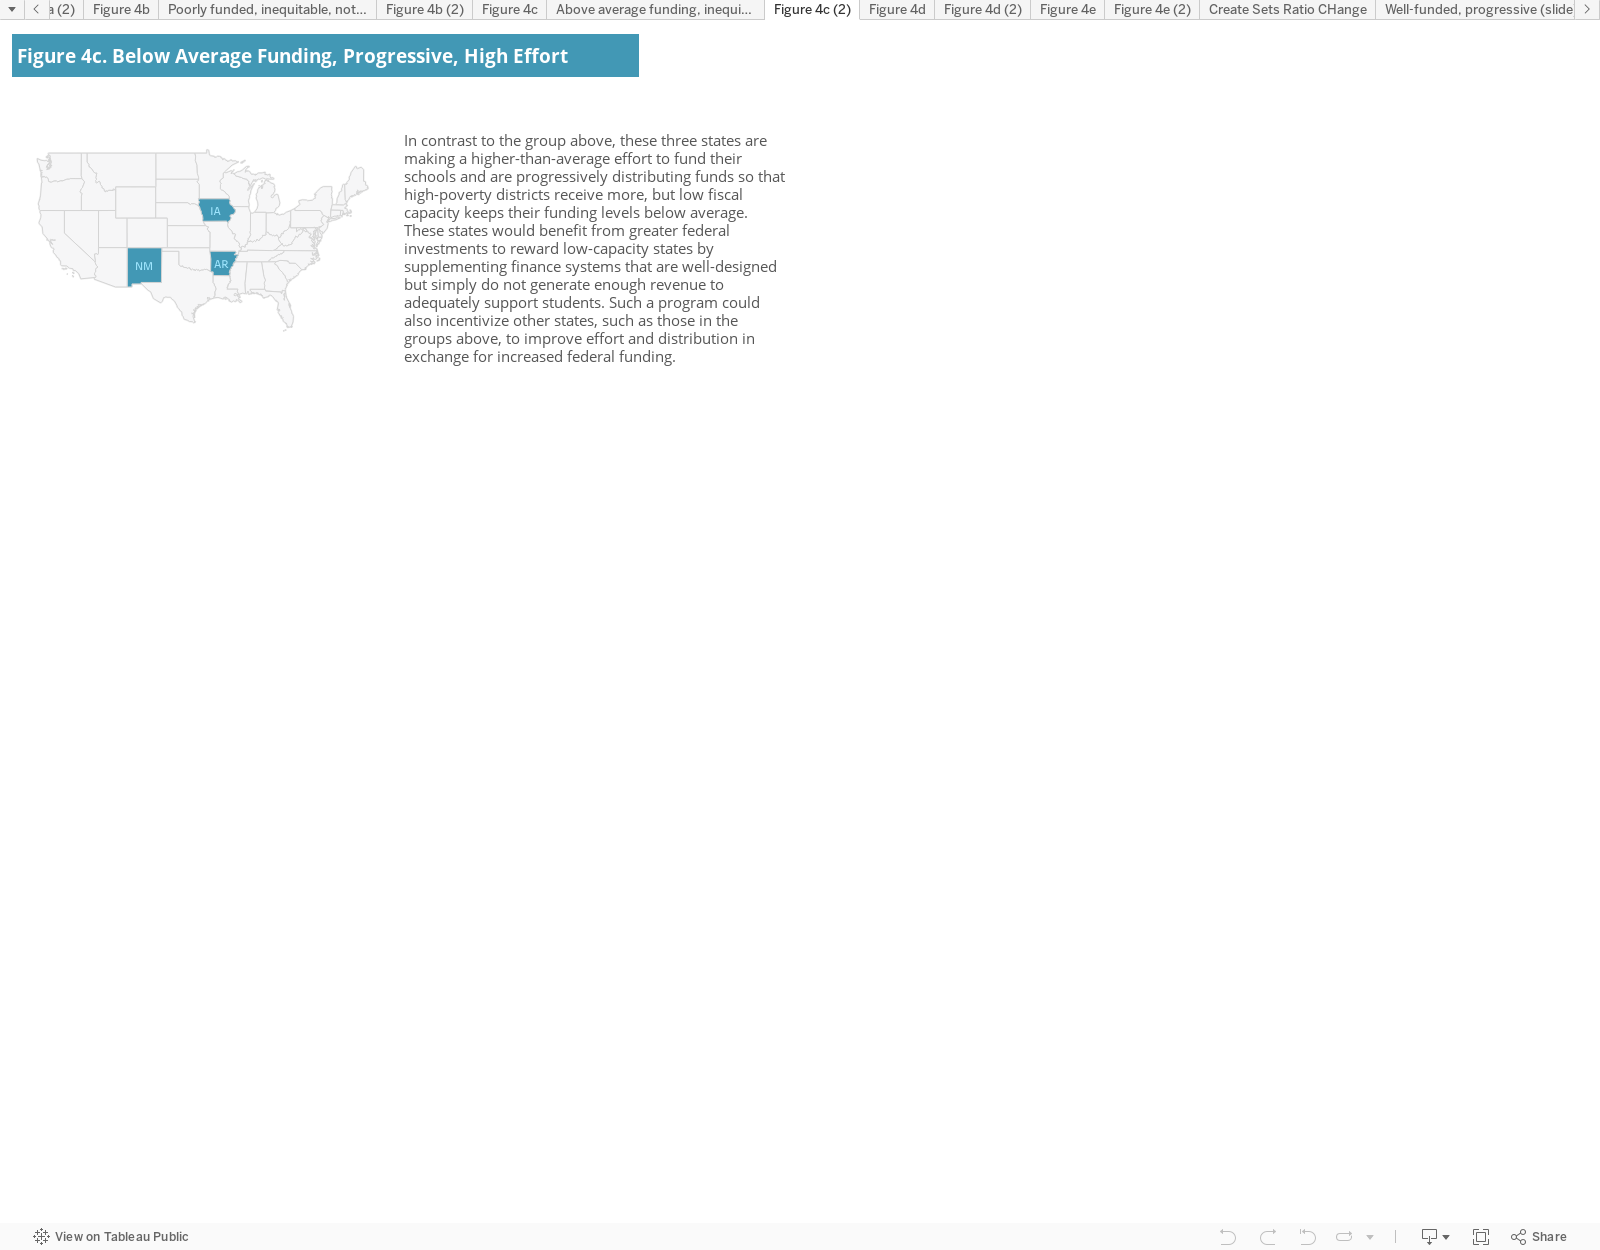
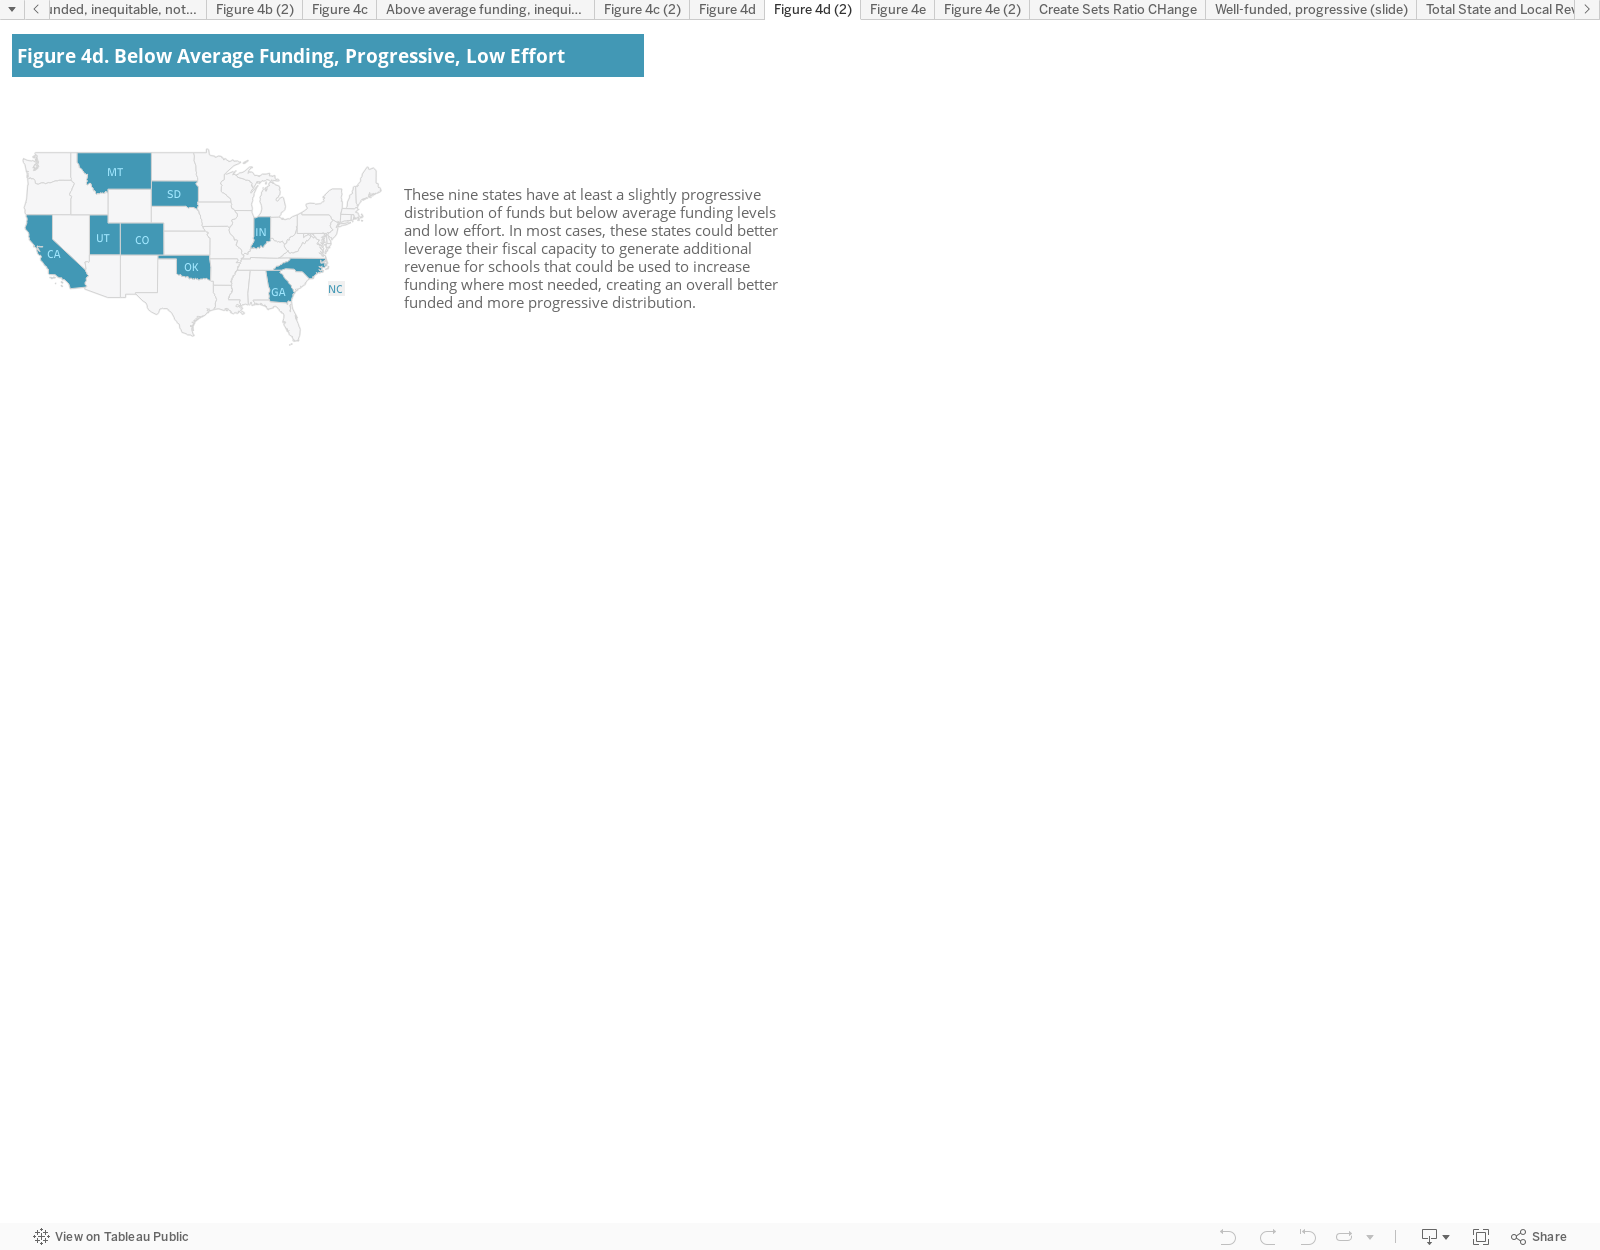
Making the Grade is meant to provide an overview of school funding fairness in the states through the examination of three interrelated factors (Table 1). We urge readers to consider each state’s rankings on the three measures collectively and not in isolation. In some cases, a state’s stellar performance in one area is completely undermined by its poor performance in another. Figures 4a – 4e provide a few classifications to explain general patterns in school funding across the country. The groupings below are not exhaustive, since some states do not fit into any of the categories provided.
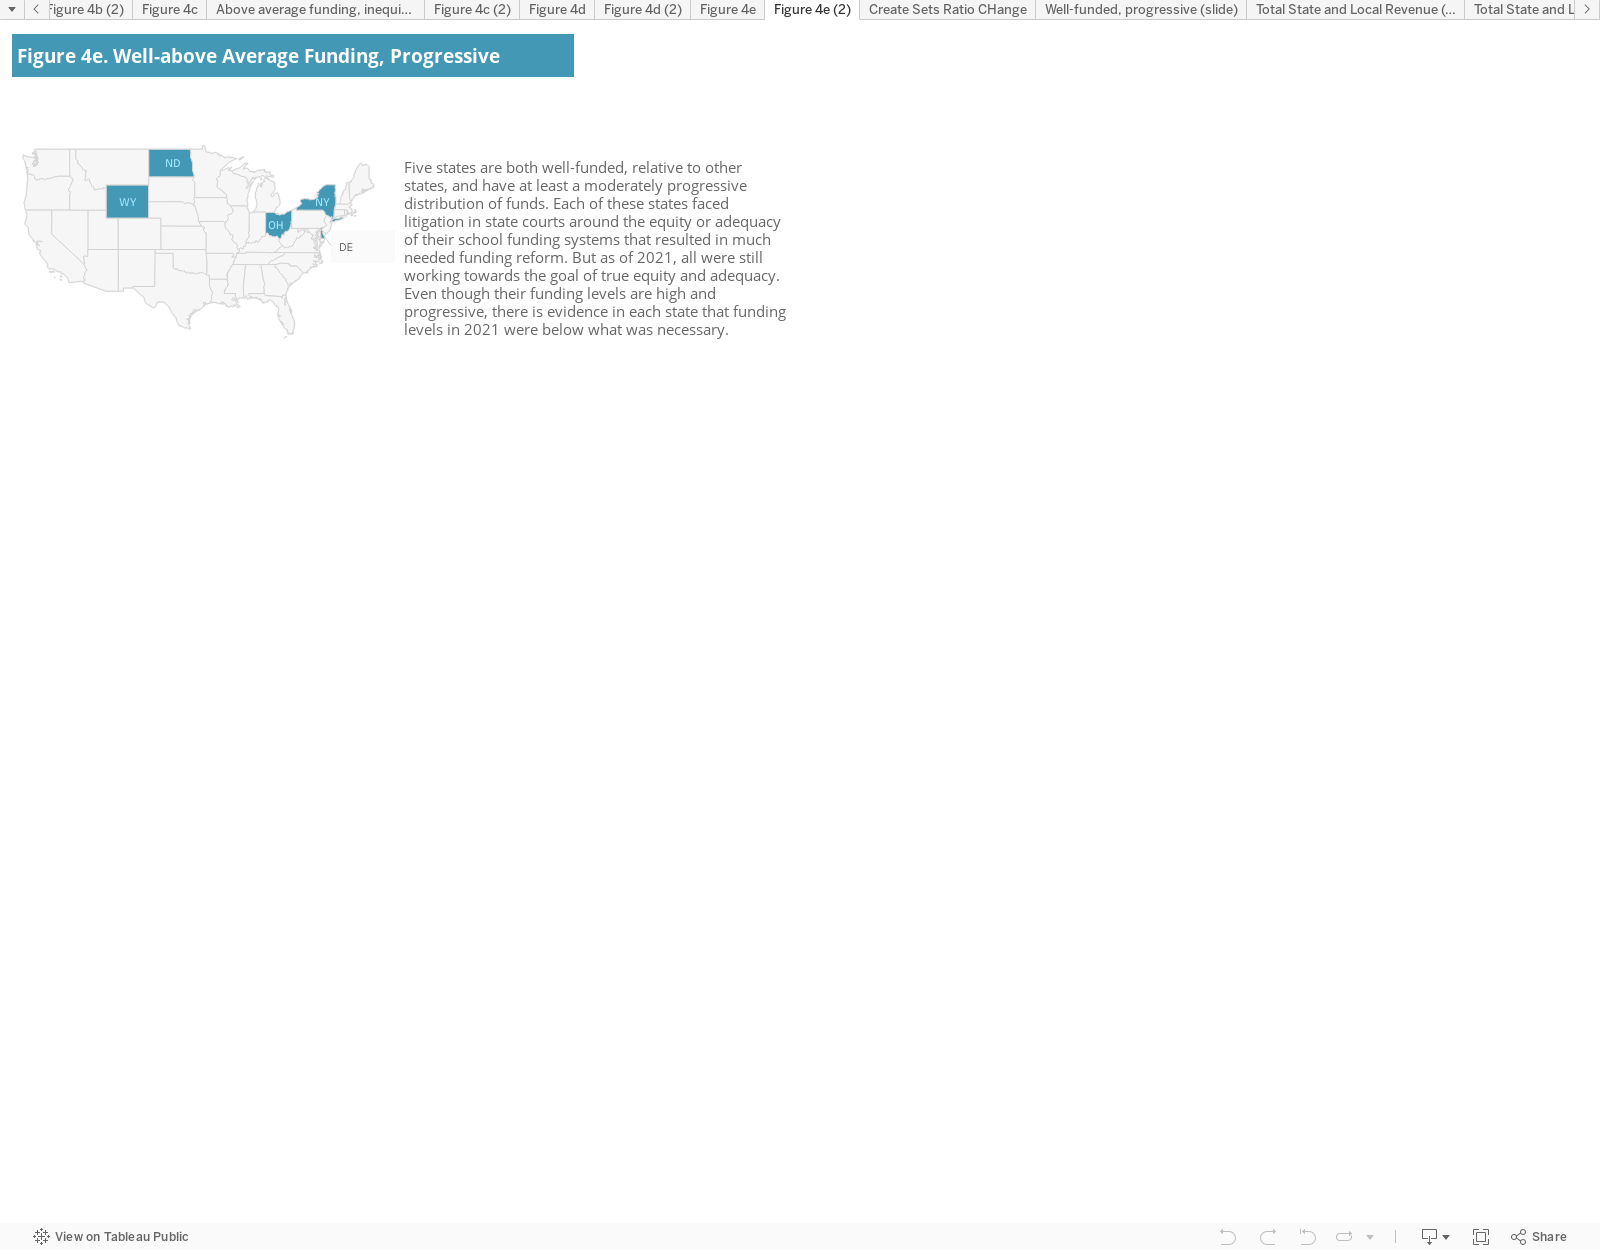
Still in Need of Improvement
In the 2020-2021 school year, two of the states in Figure 4e were still advancing remedies directly tied to litigation. Nearly twenty years after school funding was found unconstitutional by the state’s highest court in Campaign for Fiscal Equity v. State, New York was still underfunding its formula by $4 billion and facing another school funding lawsuit from New Yorkers for Students’ Educational Rights, filed in 2014.[18] That suit was eventually settled in November 2021 when state lawmakers committed to phasing in the remaining aid over a three-year period.[19] In October 2020, Delaware had just reached a settlement agreement in their finance case with implementation of reforms set for 2022 through 2025.[20]
Wyoming, North Dakota, and Ohio were all subject to school finance litigation in the early 2000’s that led to school finance reforms still reverberating in 2021. Ohio had just enacted a new school funding formula that required the state to increase state funding by $2 billion. The phase-in of funding was not scheduled to begin until 2021-2022.[21] The North Dakota Legislature narrowly avoided a school funding trial in 2006 by increasing school funding and subsequently developed a new, cost-driven school funding formula in 2013. But with issues of inequity still a concern, the Legislature established a school funding task force earlier this year to review the state’s school funding system within the context of the state’s litigation history.[22] In 2022, the Wyoming Education Association filed a complaint alleging that the state was underfunding the formula established through the Campbell school funding litigation in recent school years. The ongoing need for improvement in these relatively well-funded and progressive states illustrates the complicated nature of school funding reform, which often requires persistent pressure in both statehouses and courthouses.[23]

It is increasingly difficult to address state school funding trends without mentioning state voucher programs. The number of voucher and related bills introduced and passed in state legislatures has increased significantly in recent years.[24] In 2022-23, seven states (AR, AZ, FL, IA, NC, OH, UT) established universal voucher programs, in which every student in the state is eligible to receive public funding to attend a private school. Currently, more than half of the states and Washington, D.C. have some kind of voucher program. Initial research shows the expansion of voucher programs is correlated with a decline in the effort made to fund public schools, and universal voucher programs could drive up the cost of education between 11 and 33%.[25] In Florida alone, 10% of state funds for public education ($1.3 billion) were diverted to private education in 2022-23,[26] and estimates show this spending could reach $4 billion annually through the state’s universal voucher program.[27] Visit ELC’s campaign, Public Funds Public Schools, to learn more about efforts to ensure that all public funds for education are used to support and strengthen public schools.
Conclusion
The findings from the current version of Making the Grade are both familiar and deeply concerning. Despite the upheaval of the Covid-19 pandemic, the condition of school funding across the states remained stubbornly consistent. There continued to be enormous disparities in school funding levels among states, with the highest funded states receiving more than double the per-pupil revenue of the lowest funded states. And despite clear evidence that high-poverty districts require greater resources, less than half of the states have finance systems that systematically target additional funding to those districts. Many low-effort states have the fiscal capacity to do more to generate revenue for public schools, but instead favor low taxes and other economic policies that harm students.
In 2021, public education budgets were negatively affected by the economic uncertainty that proliferated in the early months of the pandemic. Investments in education slowed to lows not seen since the Great Recession, and in some states, that disinvestment disproportionately affected high-poverty districts, causing states to become either less progressive or even more regressive. Even though states’ economic situations were vastly improved by the end of the fiscal year, history tells us that school funding improvement can lag well behind financial recovery as legislatures and governors are often slow to re-invest in their public education systems.
The lessons of the 2020-21 school year prove, once again, that both state legislators and the federal government have an important role to play in improving opportunities for students across the country. First and foremost, states need to design school finance formulas that distribute funding both adequately and equitably, ensuring that all students have the opportunity to achieve the state’s curricular standards. The federal government must also commit to sustained support directed to the most underserved students. Lawmakers must find the political will to continue to focus on the resource needs of struggling students and districts, even as the immediate threats from the pandemic wane. Advocates and policymakers must make use of this historic focus and sense of urgency around the wellbeing of the nation’s students to bolster and support public schools, ensuring that the resources they need, no matter where they are located, are always available to them.
Endnotes
[1] National Association of State Budget Officers. (2021). Budget Processes in the States. https://higherlogicdownload.s3.amazonaws.com/NASBO/9d2d2db1-c943-4f1b-b750-0fca152d64c2/UploadedImages/Budget%20Processess/NASBO_2021_Budget_Processes_in_the_States_S.pdf
[2] MacKellar, Erica. (2020). Late State Budgets. National Conference of State Legislators. https://www.ncsl.org/fiscal/late-state-budgets
[3] Leachman, M. and McNichol, E. (2020). Pandemic’s Impact on State Revenues Less Than Earlier Expected But Still Severe. (2020). Center on Budget and Policy Priorities. https://www.cbpp.org/research/state-budget-and-tax/pandemics-impact-on-state-revenues-less-than-earlier-expected-but
[4] Districts are required to use these funds to support the following activities: safely reopening schools, maintaining safe school environments, and addressing the social, emotional, and academic needs of students.
[5] The federal government passed three major Covid relief packages with specific funding targeted to support school districts: Coronavirus Aid, Relief, and Economic Security (CARES) ESSER I, $13 billion approved in March 2020; Coronavirus Response and Relief Supplemental Appropriations Act (CRRSA) ESSER II, $54 billion approved in December of 2020; and American Rescue Plan (ARP) ESSER: $122 billion approved in March 2021. All three ESSER packages included Maintenance of Effort provisions and ARP ESSER include a Maintenance of Equity provision.
[6] Kane, T. and Reardon, S. (2023). Parents Don’t Understand How Far Behind Their Kids Are in School. New York Times. https://www.nytimes.com/interactive/2023/05/11/opinion/pandemic-learning-losses-steep-but-not-permanent.html
[7] This measure does not include figures for Hawaii and the District of Columbia which operate as single district systems. Vermont is also excluded because of reporting inconsistencies. See the Technical Appendix for more information.
[8] McKillip, M. and Luhm, T. (2020). Investing Additional Resources in Schools Serving Low-Income Students. Newark, NJ: Education Law Center. https://edlawcenter.org/assets/files/pdfs/publications/Investing_in_Students_Policy_Bri.pdf
[9] The United States has no established “opportunity to learn” standards that define the resources needed to ensure students have the opportunity to achieve common outcomes. It is, therefore, not feasible to determine the cost of those resources and funding levels across states.
[10] The drop in enrollment could affect districts in 2022 and beyond, depending on whether states implemented hold harmless provisions. See Presume, R. (2021). How Temporary ‘Hold Harmless’ Policies Could Save Schools and Districts. The Education Trust. https://edtrust.org/the-equity-line/how-temporary-hold-harmless-policies-could-save-schools-and-districts/
[11] Like our funding level measure, the total figures exclude capital funding and include federal Impact Aid and Indian, Native Hawaiian, and Alaska Native Education Aid. The revenue totals do not adjust for regional cost differences since we are comparing revenue levels within states, not between states.
[12] Lieberman, M. (2022). Inflation is Putting the Squeeze on Schools. How Are They Coping? EdWeek. https://www.edweek.org/leadership/inflation-is-putting-the-squeeze-on-schools-how-are-they-coping/2022/07
[13] Poverty is measured using the Census definition due to reporting inconsistencies for the National School Lunch Program, the more commonly used metric of school poverty. Census poverty is a more severe measure than either free lunch (130% of Census poverty) or reduced lunch (185%) eligibility. We define high-poverty districts as having a 30% Census poverty rate among school-aged children and low-poverty districts having a 5% poverty rate. For more detail, see the Technical Appendix.
[14] Gross domestic product (GDP) is the value of all goods and services produced by each state’s economy. In this report is serves as a measure of each state’s capacity to raise revenue to fund schools.
[15] Farrie, D. and Sciarra, D.G. (2021). $600 Billion Lost: State Disinvestment in Education Following the Great Recession. Education Law Center. https://edlawcenter.org/research/$600-billion-lost.html
[16] Lazere, E. (2022). States With Temporary Budget Surpluses Should Invest in People, Not Enact Permanent Tax Cuts. Center on Budget and Policy Priorities. https://www.cbpp.org/research/state-budget-and-tax/states-with-temporary-budget-surpluses-should-invest-in-people-not
[18] Alliance for Quality Education. (2021). Cuomo’s Broken Promises to New York’s Students. https://www.aqeny.org/2021/04/02/cuomos-broken-promises-to-new-yorks-students/
[19] SchoolFunding.Info. (n.d.). New York. http://www.schoolfunding.info/litigation-map/new-york/#1483935373027-3dbbdb06-bbb7
[20] SchoolFunding.Info. (n.d.). Delaware. http://www.schoolfunding.info/litigation-map/delaware/#1484014246781-67d7bfcb-eb16
[21] Churchill, A. (2023). Ohio’s New School Funding Formula: An Introduction. Thomas B. Fordham Institute. https://fordhaminstitute.org/ohio/commentary/ohios-new-school-funding-formula-introduction
[22] Gasser, M. (2023). Panel Seeking ‘Equity’ in North Dakota School Funding. Longview News-Journal. https://www.news-journal.com/panel-seeking-equity-in-north-dakota-school-funding/article_6322647b-5f8d-509c-b5d5-1229680fced5.html
[23] Sciarra, D. and Dingerson, L. (2021). From Courthouse to Statehouse – and Back Again. Education Law Center. https://edlawcenter.org/assets/files/pdfs/School%20Funding/ELC_Report_Courthouse_to_Stateho.pdf
[24] Public Funds Public Schools Bill Tracker. https://pfps.org/billtracker/
[25] See Abrams, S.E. and Koutsavlis, S.J. (2023). The Fiscal Consequences of Private School Vouchers. Public Funds Public Schools, https://pfps.org/assets/uploads/SPLC_ELC_PFPS_2023Report_Final.pdf; Shand, R. and Levin, H.M. (2021). Estimating a Price Tag for School Vouchers. National Education Policy Center.
[26] McKillip, M. and Dollard, N. (2022). Florida’s Hidden Voucher Expansion. Education Law Center. https://edlawcenter.org/assets/Florida/Florida-Hidden-Voucher-Expansion.pdf
[27] Education Law Center. (2023). HB1 Universal Voucher Program Would Cost Billions. https://edlawcenter.org/news/archives/school-funding-national/hb1-universal-voucher-program-would-cost-billions.html