Mary McKillip and Danielle Farrie
Abstract
Tennessee’s school funding formula does not adequately support the state’s schools. This report analyzes the impact of underfunding on staffing levels and the resulting inequities created between high- and low-income school districts. The state’s school formula funding, even when supplemented by local funding above the required local share, results in lower staffing levels in poorer districts in nearly every staffing category. Our findings show: (1) Nearly all districts raise more local funds than required. (2) Wealthier districts supplement with funds to reduce the average state student-teacher ratio of 23:1 ratio to 19-20 students per teacher, while the poorest districts average a student-teacher ratio of 24:1. (3) The English language learner to English as a second language teacher ratio is twice as high in poor districts than in wealthier districts. (4) Many districts have extremely limited access to student support staff such as social workers, counselors, and psychologists.
Report PDF | Press Release | Interactive Tools | BEP Primer
Introduction
Tennessee’s school funding formula – the Basic Education Program (BEP) – does not provide enough funding to adequately resource the state’s schools. This has been amply documented.[1] This report builds on previous research by analyzing the impact of underfunding on staffing levels and the resulting inequities created between high- and low-income school districts.
As Tennessee faces an economic crisis and the ongoing interruption of student learning caused by the current pandemic, resources such as small class sizes, sufficient support staff, and remedial interventions will be crucial to reopen schools safely and make up for lost instructional time for returning students. This is especially true in low-income districts that were already underfunded before the pandemic. Districts need more, not less, support from the state formula right now.[2] BEP formula funding, even when supplemented by local funding above the required local share, results in lower staffing levels in poorer districts. Our findings show:
- Nearly all districts raise more local funds than required. Districts with the least fiscal capacity raise, on average, $375 per pupil above the level required by the BEP formula, compared to over $2,350 in districts with the most fiscal capacity.
- The BEP funds on average one teacher for every 23 students. Wealthier districts are able to supplement with local funds to reduce that ratio to 19-20 students per teacher, while the poorest districts average a student-teacher ratio of 24:1.
- The population of English language learners (ELL) is significantly higher in the poorest districts than in the wealthiest (10% vs. 3%); yet the ELL student to ESL teacher ratio is twice as high in poor districts than in wealthier districts.
- Of the 140 districts in the state, 111 did not have a single social worker on staff, including 15 of the poorest districts.
- Twelve districts across the state had no social worker, no psychologist and a student to counselor ratio above 600. These districts educate over 25,000 students, nearly 40% of whom are poor.
According to Education Law Center’s Making the Grade 2019 report, Tennessee is one of the least fairly funded states in the nation. The state’s cost-adjusted per pupil funding ranks near the bottom (43rd) and is not fairly distributed by poverty. Low-income districts, on average, receive about the same level of funding as wealthy districts. Tennessee also makes minimal effort to fund its schools, allocating the third lowest percentage of state GDP to PK-12 education.
BEP Formula Does Not Reflect Cost of Educating At-Risk Students
The BEP formula provides funding based on the cost of the resources needed to operate schools (instructional and non-instructional staff, administration, operations, etc.). For instructional staff, districts get funding based on average salaries and the number of positions generated using a prescribed student to teacher ratio at the district level. The ratios vary based on position, by grade level, regular or special education, and subject area. For example, using a student to teacher ratio of 20:1, a district with 100 K-3 students would generate funding for 5 teachers. Districts are not tied to the ratios used in the BEP formula; the actual number of staff employed by the district may be above or below the number of positions generated by the formula.
See the BEP Primer for a detailed overview of the funding formula
Districts require more funding to educate lower income students. It is well documented that students in poverty tend to enter school less prepared than their wealthier peers and may lack other family and community resources that would further support their learning growth.
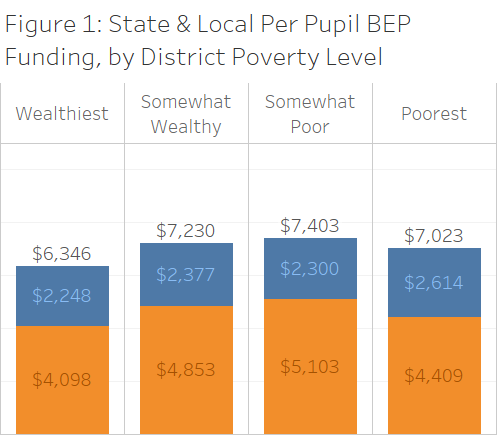
In theory, the Tennessee BEP formula recognizes this need by including funding for each “at-risk” student, or student in poverty. This additional funding was $886 per pupil in 2018-19. Once adjusted for variations in the cost of living, however, BEP funding is not higher in districts with more students in poverty.
As can be seen in Figure 1, although the very wealthiest districts are funded at the lowest level, averaging $6,346 per pupil, there is very little variation between the remaining three wealth categories. The poorest districts do not get a notable funding advantage over the wealthier districts. Even the modest additional funding for poverty in the BEP is essentially offset by the higher cost of living in urban districts like Davidson and Shelby, where Nashville and Memphis are located.
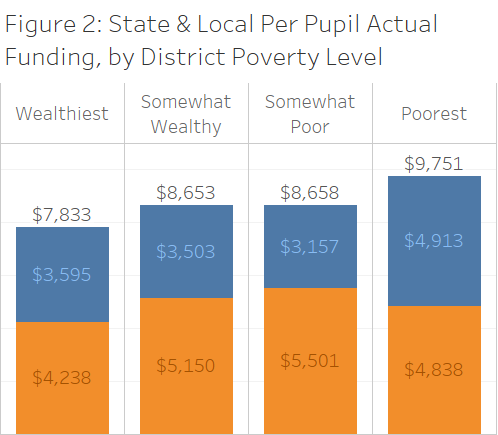
Figure 2 shows the actual amount of state and local funding districts receive. Differences between BEP funding levels and actual funding levels are largely driven by districts providing local funding above the BEP required amount (the state provides a small amount of additional funding outside the BEP formula). On average, the wealthiest districts receive $7,833 per pupil (after adjusting for cost of living, which tends to be higher in these districts), while the moderate wealth and somewhat poor districts average about $8,650 per pupil. The poorest districts receive an average of $9,751 per pupil.
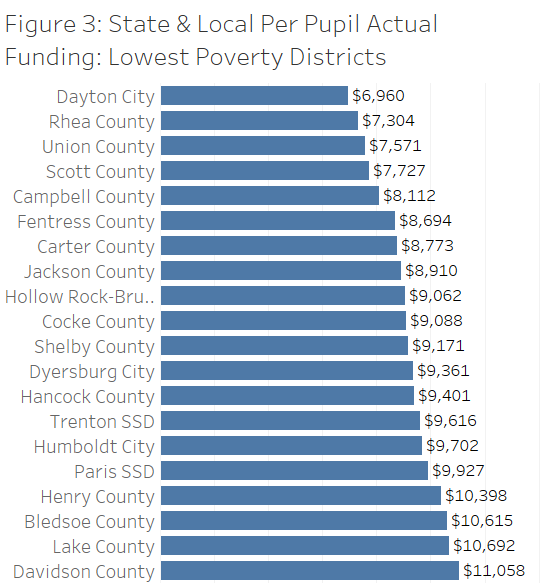
The averages displayed in Figure 2 mask significant variation in actual funding levels within the poverty groups (see Figure 3). For example, though Dayton City and Davidson County have similar poverty rates, there is a $4,000 gap in funding between them.[3]
Nearly all districts raise local funds above the BEP requirement. The ability of districts, both wealthy and poor, to increase funding is directly tied to their fiscal capacity to raise additional local funds. Districts with the lowest fiscal capacity (as measured by the formula to determine state share) raise, on average, less than $375 per pupil above the level required by the BEP formula, compared to over $2,350 in districts with the highest fiscal capacity.
The funding levels among Tennessee’s school districts make clear that the BEP formula is neither adequate nor equitable. The BEP does not, in theory or application, include a predictable relationship between student poverty and funding, an essential feature of an equitable school funding formula.
Persistent Staffing Shortages in the Poorest Districts
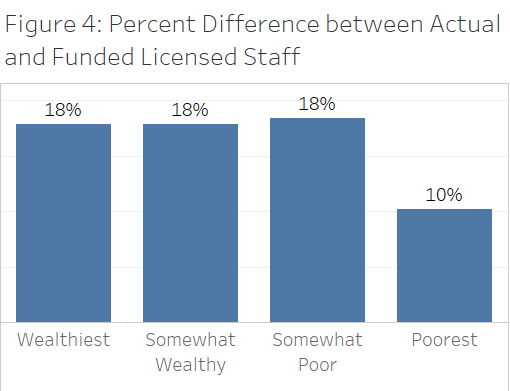
The BEP formula, even supplemented by local funding, results in lower staffing levels in the poorest districts than in their wealthier counterparts. [4] As Figure 4 shows, the poorest districts hired 10% more staff than the BEP provides, while all other district types hired 18% more. Districts at all poverty levels are hiring many more staff than are covered through BEP funding, but the poorest districts tend to remain more understaffed than wealthier districts.
Teachers
Every district in the state except one (Lenoir City) hires more classroom teachers than the BEP funds. These additional hires range from just a few teachers to a 50% increase (Lake County). Twenty-nine districts across the state, ranging from wealthy Franklin SSD to high poverty districts such as Rhea and Carter County, hired at least 25% more teachers than were funded through the BEP.
Find details on specific districts’ funding and staffing levels in the Appendix and Online Interactive Tools.
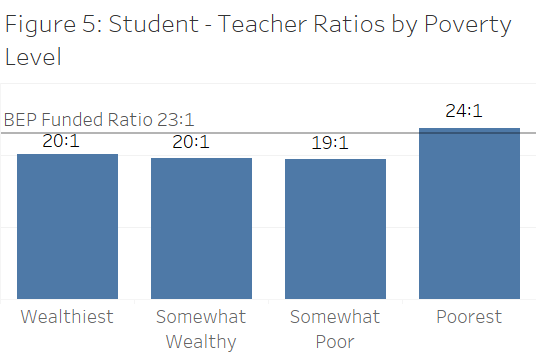
Figure 5 shows that, on average, all districts except the poorest manage to keep their student to teacher ratios lower than the BEP funded ratio with these additional hires. The BEP funds at an average rate of 23 students per teacher.[5] Wealthier districts are able to supplement with local funds to reduce that ratio to 19-20 students per teacher, while the poorest districts average a student-teacher ratio that is higher than the funded rate at 24:1.
A closer look at student-teacher ratios in the poorest districts shows that this staffing disadvantage is especially problematic in Davidson and Shelby Counties, which educate nearly a third of all poor students in the state and have student to teacher ratios of 25:1 and 26:1, respectively. All the other “poorest” districts use some combination of local supplemental revenue and the BEP’s at-risk funding to reduce their ratios to 22:1 or lower with an average of 19:1. This still puts them at a disadvantage relative to their wealthier peers. The BEP at-risk funding is intended to help schools lower class-size ratios to 15:1 in poorer districts, but student-teacher ratios suggest this goal is well out of reach.
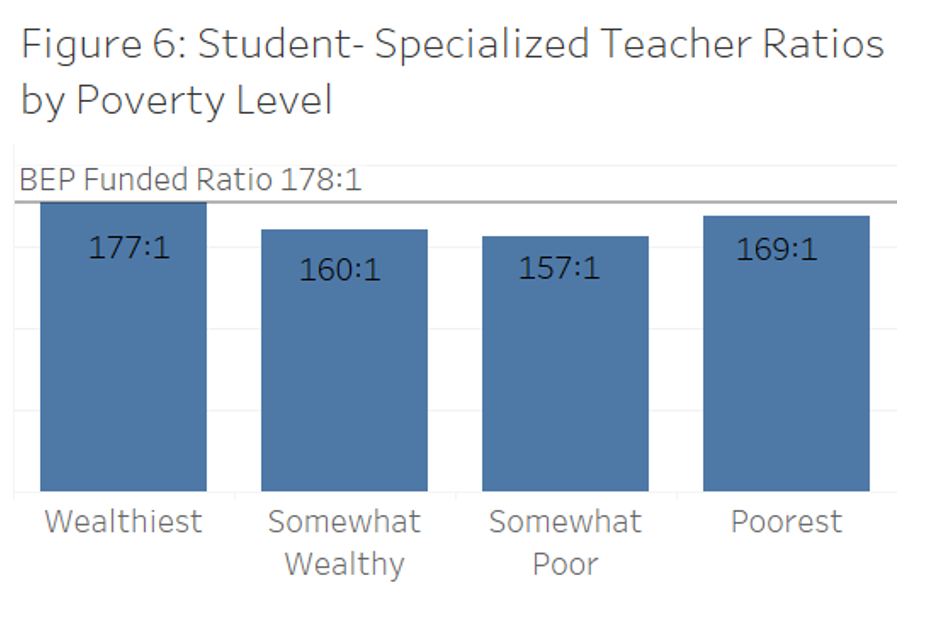 Student-teacher ratios for specialized teachers (art, music, P.E. teachers and librarians) are more balanced by district poverty and similar to the BEP funded ratio, as seen in Figure 6, though there are variations within poverty groupings. Some districts hired more staff than they are allotted through the BEP while others hired far fewer. Some of the poorest districts hired more than the average BEP allotted staff of 1 per 178 students. For example, Carter County has 166 students per specialized teacher, and Shelby County’s ratio is 165:1. Other districts hired fewer. For example, Dyersburg’s student to specialized teacher ratio is 231:1, and Union County’s ratio is 298:1.
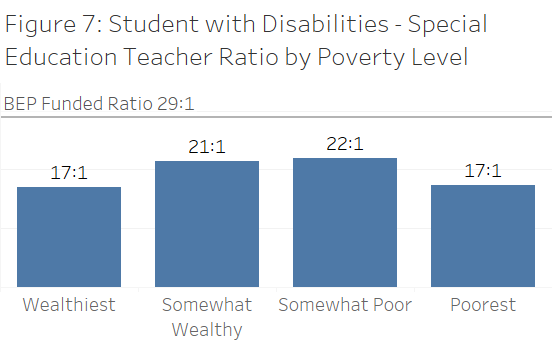
Ratios of students with disabilities to Special Education teachers are well below the BEP funded ratio of 29:1 in all district poverty groupings, showing that districts are allocating a great deal of additional funding to hire Special Education staff to support their students. The wealthiest and poorest districts have the lowest average ratios at 17 students with disabilities per Special Education teacher, though there is variability in these ratios. For example, Williamson’s ratio is 10:1, and Shelby’s is 13:1; on the other end, Fentress’ ratio is 40:1, and Crockett’s is 39:1.
ESL teachers are hired at a rate below the BEP funded rate in districts at all poverty levels, but even fewer are hired in the poorest districts, as seen in Figure 8. The wealthiest districts average a rate of 22 ELLs per ESL teacher, while the poorest districts average 40 ELLs per ESL teacher.
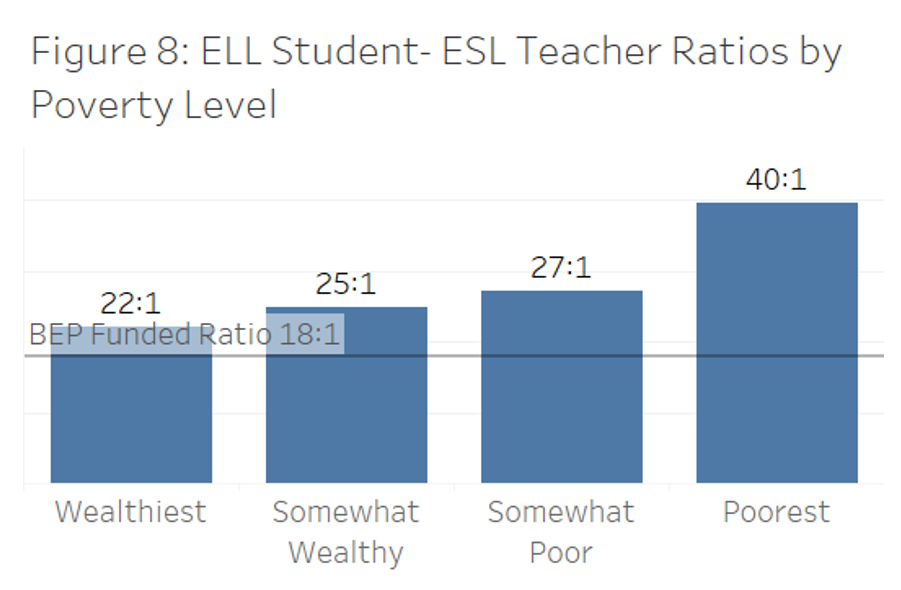 This lack of ESL teachers in the poorest districts is more alarming when considering that 10% of students in the poorest districts are ELLs, compared to an average of only 3% in wealthier districts.
The five districts serving 67% of all ELL students in the state exemplify these ELL resource inequities. The wealthy district Rutherford serves 2,593 ELL students and has an ELL student to ESL teacher ratio of 24:1, while the somewhat wealthy district Knox has 2,727 ELL students and a ratio of 29:1. In comparison, the poor district Davidson serves 13,884 ELL students and has an ELL student to ESL teacher ratio of 47:1; the poor district Shelby serves 8,156 ELL students with a ratio of 33:1; and the somewhat poor district Hamilton serves 2,679 ELL students with a ratio of 31:1.
Counselors
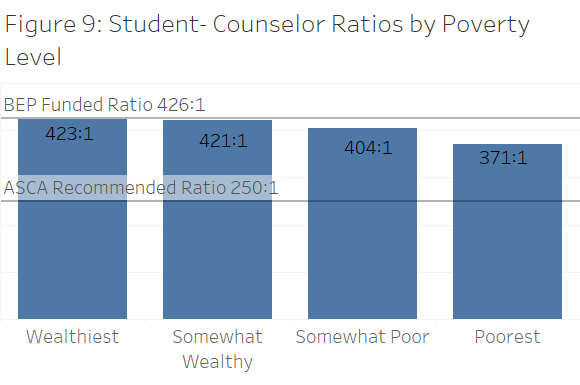
The BEP provides funding for one counselor for every 426 students, which generates 2,146 positions across the state. However, districts hired 2,364 counselors, 218 more than the BEP funded amount. Student to counselor ratios are generally in line with BEP funded ratios, though poorer districts have smaller ratios, on average, as would be expected given the greater resource needs among these student populations (see Figure 9). Districts fall far from the nationally ratio recommended by the American School Counselor Association.
However, a closer look shows that these lower student-counselor ratios in the poorest districts are largely driven by the relatively low ratios in Shelby (351:1) and Davidson Counties (364:1), while many of the other poor districts have unacceptably high counselor caseloads. Seven of the 20 poorest districts have student to counselor ratios above 600:1 (Dayton City, Paris SSD, Union County, Lake County, Scott County, Fentress County, and Dyersburg City). Such ratios likely curtail efforts to meet students’ social and emotional needs and college and career guidance that is especially crucial for low-income students.
Social Workers
The BEP funds one social worker for every 2,000 students, a ratio that is eight times higher than the nationally recommended level (250:1) (as recommended by the School Social Work Association of America). And yet, most districts across the state are not able to staff their schools at even this inadequate level. The ratios range from an astounding one social worker for every 10,000 students in the wealthiest districts to approximately one per 2,000 students in the poorest districts (see Figure 10). The formula generates 469 social work positions, yet there were only 211 social workers employed across the state. In fact, 111 of the 140 districts did not have a single social worker on staff.
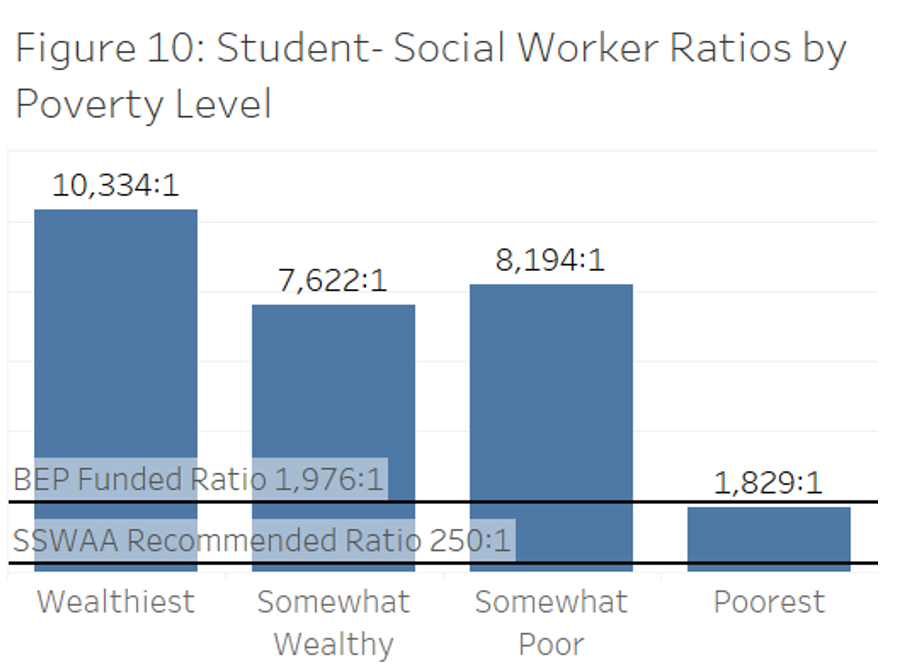
The poorest districts in the state are likely to be the most in need of the support social workers provide, and yet most students in these schools have no or limited access to such resources. Shelby and Davidson, the two largest urban districts, are outliers in that they hired more social workers than the BEP provides. Even so, their student-social worker ratios are about six times the nationally recommended level. Of the remaining 18 poorest districts, 15 have no social worker. The other three districts have one social worker each, resulting in absurdly large caseloads. The situation is no better in the 53 “somewhat poor” districts: 44 have no social worker on staff, and the other nine employ only one social worker, in some cases part-time, for the whole district. Ratios range from one full-time social worker for about 700 students in Milan SSD to one part-time (20%) social worker for over 4,000 students in Coffee County.
Psychologists
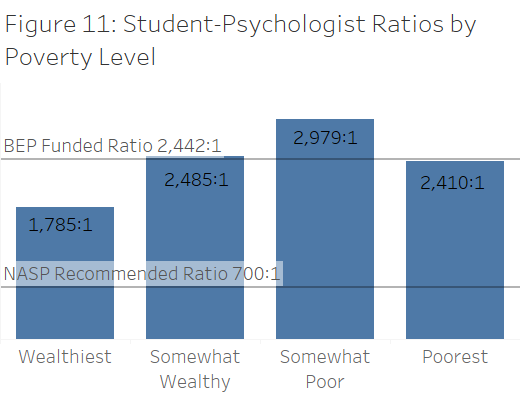
The BEP funds one psychologist for every 2,500 students, a level that is again drastically out of line with recommendations of the National Association of School Psychologists. Actual hires are quite close to the 402 positions funded by the BEP with 379 psychologists employed by districts across the state, though they are not evenly distributed (see Figure 11). The wealthiest districts hired 40% more psychologists than they are funded for and have the lowest staff to student ratio. Overall, the moderately wealthy districts hired about as many psychologists as are funded by the BEP, but some individual districts hired more (Knox County, Murfreesboro City) while 21 of the 49 districts do not have any psychologists on staff.
About half of the somewhat poor and poorest districts in the state also did not have a psychologist on staff. This includes some large districts, such as Hamblen County, Lawrence County, Sullivan County and Carter County, all of which have student enrollments of 5,000 or more. Shelby County hired fewer psychologists than the BEP funds, resulting in a student to psychologist ratio of over 3,600 to 1. Davidson County hired nearly twice as many psychologists as they are funded for, but that still left the district with over 1,400 students per psychologist, double the recommended level.
Students Denied Adequate Support
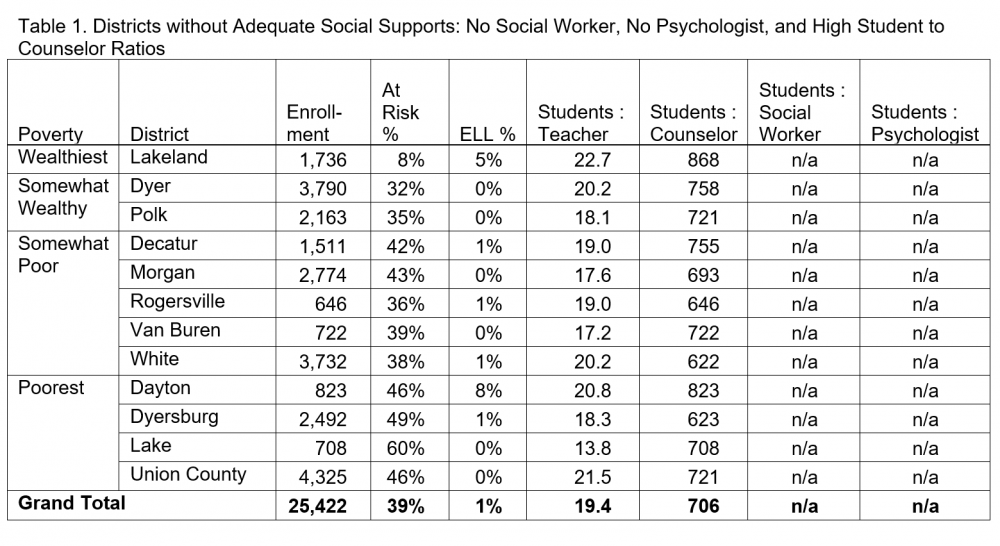
A handful of poor districts stand out as having gravely under-resourced schools that leave students without meaningful access to the support services that are critical to their success. Twelve districts across the state had no social worker, no psychologist and a student to counselor ratio above 600 (see Table 1).
These districts educate over 25,000 students, nearly 40% of whom are poor. Most concerning are the nine districts in the somewhat poor or poorest categories where these social and emotional supports are especially necessary, given the impact of the pandemic, to ensure that students and staff have the resources they need to succeed. In all cases, these districts had student to teacher ratios that were below BEP funded levels, suggesting that they are prioritizing smaller class sizes over support services, a choice that no district, especially one serving a high need population, should be forced to make.
Recommendations
Overall, our analyses match-up with findings from past reports demonstrating that Tennessee’s BEP formula funding is wholly inadequate to properly fund school districts across the state. In addition, this report presents further evidence that Tennessee’s BEP formula funding is deeply inequitable, with staffing shortages in the poorest districts noticeably worse than in wealthier districts. The at-risk funding in the BEP formula is not sufficient, even with additional local funding, to bring staffing ratios in poorer districts anywhere near national averages or recommended levels.
“The [Tennessee Advisory Commission on Intergovernmental Relations] recommends a comprehensive review of the components be made by the BEP Review Committee or other designated state and local officials and other state holders to ensure that the BEP funding formula supports a commonly accepted basic level of education for Tennessee students.” TACIR Report, 2020
Addressing the persistent and severe staff shortages in all districts, but particularly in higher poverty districts, requires a complete overhaul of the state’s school funding formula. An independent study of the actual costs of educating Tennessee students, especially at-risk students and those in the poorest districts, is urgently needed. That study can then serve as a basis for the Legislature to jettison the BEP for an up-to-date, cost-based formula weighted for student need.
The COVID-19 pandemic shines a harsh light on the staffing shortages that already exist in poor districts. Throughout the current school year, additional staff members will be needed to address the repercussions of statewide school closures. Not only teacher shortages, but also a shortage of counselors, social workers, and nurses will make recovery more difficult. The pandemic underscores the need for the state of Tennessee to rethink its school funding formula and set the stage for long-term improvement. In the meantime, it is imperative that Tennessee maintain all financial resources currently earmarked for districts with large numbers of students in poverty and provide additional support to these districts wherever possible.
Endnotes
[1] For example, the BEP Review Committee, the Tennessee Advisory Commission on Intergovernmental Relations, the Tennessee Comptroller of the Treasury and a BEP Task Force have highlighted the state’s inadequate school staff funding and the need to overhaul the BEP school funding formula.
[2] District poverty is based on the proportion of students in poverty. “Wealthiest” means less than 25% students in poverty (18 districts serving 200K students), 25-<35% are “Somewhat Wealthy” (49 districts, 300K students), 35-<45% are “Somewhat Poor” (53 districts, 250K students), 45% or more students in poverty are the “Poorest” districts (20 districts, 230K students).
[3] The size and cost of living in districts play a role in the variation in district funding (larger districts and districts in more expensive communities must expend more to support their schools). As noted earlier, high poverty districts also require more resources to serve their students. In reviewing expenditure data for the largest districts in Tennessee, districts spending above the state average do so across all expenditure categories, (instruction, student support, instructional staff support, administration, maintenance and operations, and other).
[4] Data used in this report come from publicly available Tennessee data files, primarily the FY19 BEP Calculator and the TNDOE 2019 Annual Statistical Report, as well as 2018-19 district demographic and assessment proficiency data available from TNDOE Data Downloads.
[5] The teacher ratios in Figure 5 are reflective of regular K-12 classroom teachers and Career and Technical Education (CTE) teachers and account for the majority of instructional staff in the schools.